
Hits: 2862
WESTCHESTER COUNTY NEW FIRST-TIME COVID INFECTIONS DECLINE FIRST TIME IN 4 WEEKS
COVID INFECTIONS HAVE INCREASED IN 10 WEEKS OF LAST 13 DATING BACK TO APRIL 1
REINFECTIONS OF COVID SUFFERERS “OVER COVID” SURGE OVER SAME STRETCH. UNKNOWN FACTOR AS FALL “NORMAL” RETURNS MAYBE.
WPCNR CORONAVIRUS REPORT. From New York State COVID TRACKER & REINFECTIONS TRACKER. Observations & Analysis by John F. Bailey.
The week from Sunday July 17 through Saturday, July 23, saw 2,360 persons come down with new first time infections of covid, a decline for the first time in 4 weeks of 6% from last week (2,512).
The New York State Health Department reports the omicron variant has been responsible for reinfecting thousands across the 7 county Mid-Hudson Region, with the B.a. varient on the way.
The county saw 337 new first-time infections a day of covid in last week’s reduced number of covid infections .
In the last four weeks dating back through Sunday June 27, the county averaged 330 new infections a day. The average new infections a day has been consistent.
To date in the month of July from July 1 through July 23, Westchester County has reported 7,825 new first-time Covid sufferers, on track for approximately 10,000 new first time covid cases for the month.
If the present average rate of new infections a week of 2,399 “new” infections (each week for the last 4 weeks) continues, the month of July will see 10,224 infections for the month.
This is not good, considering during last July 2021 recorded 1,782 infections in Westchester County when an average 2% infection rate in Westchester County plus relaxed restrictions lead to a resurgence of covid that eventually balooned into the January 2022 all time high of first infections that was stopped by the vaccines. Now tracking of reinfections by the State Health Department is casting doubts on the prolonged effects of the vaccines.
This month Westchester is on track for 8,442 more than the 1,782 infections Westchester had last July.
Superintendents of Schools, City and town leaders should be contemplating now what this could mean in new infections as well as more reinfections, now giving new momentum to the resurgence of covid despite assurances that covid is no longer as serious a sickness as once thought. I don’t want to get it, do you?
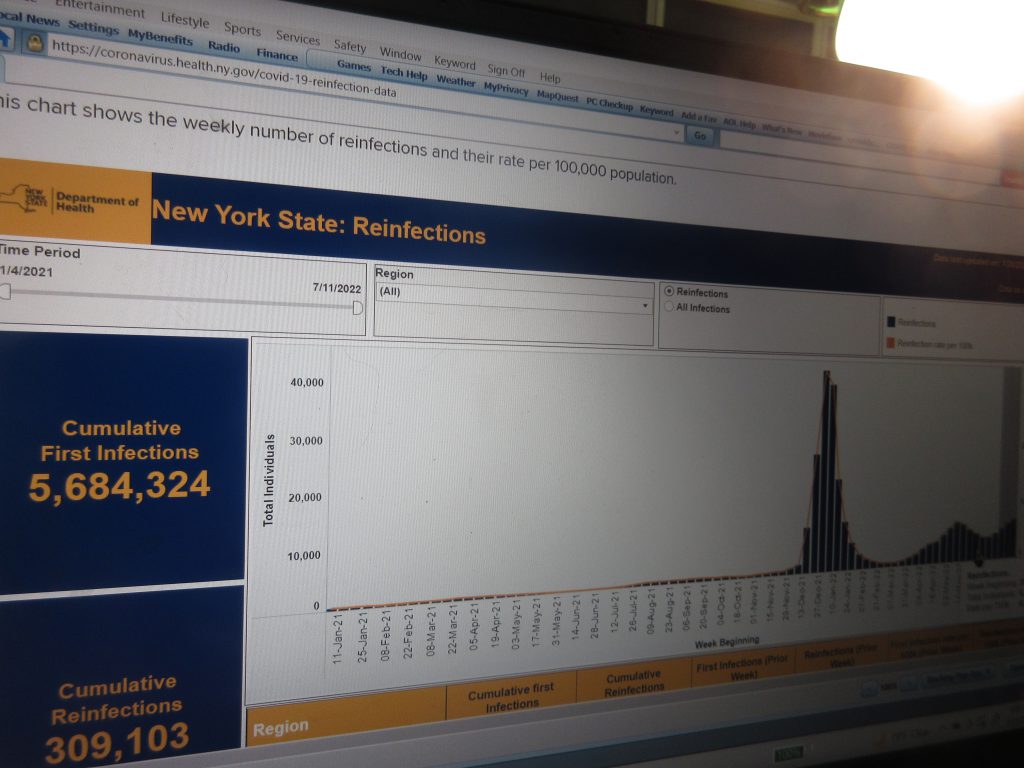
A second presentation by the New York State has tracked the rate of persons “cured of covid” who have become reinfected with covid after 90 days of first having the disease. Bear in mind as you look at this chart.
How many more Reinfections have to come back to plunge persons who have had the disease for the first time back into the misery of covid, never mind how less serious the disease is.
But rather than speculate, before I show you this chilling chart. (I find it chilling.) Here is what the New York State Health Department says about it:
“As the Omicron variant emerged in New York State, the number of people who have been infected with COVID for a second time has increased dramatically (“reinfection”). The Department of Health recently released a study with California and the CDC that looks at the occurrence of reinfection, among other trends. The Department will update reinfection data here on a weekly basis.
What is a reinfection?
A reinfection is when a person becomes infected with COVID, enough time passes, and later becomes infected again. A person is considered to have been reinfected if they test positive again 90 days or more after their first positive test.
How does this relate to other testing information DOH publishes?
Because data on reinfections and new infections are collected in different ways, they must be presented separately.
The COVID-19 daily testing tracker and the positive tests over time dashboard show the number of first-time infections in New York State, based on when these new infections are reported to the State.
The reinfection page presents the number of unique instances a person tested positive, thus including those who have tested positive again 90 days or more after their first positive test. To ensure each positive case is at least 90 days apart, reinfection cases are tracked by the date the sample was collected.
Due to high volumes and differing reporting practices and timing, many testing sites do not report a case the same day the specimen is collected or the positive result is confirmed.
As a result, the total for any single day will differ between these two reports.”
Here is that Reinfection Chart:
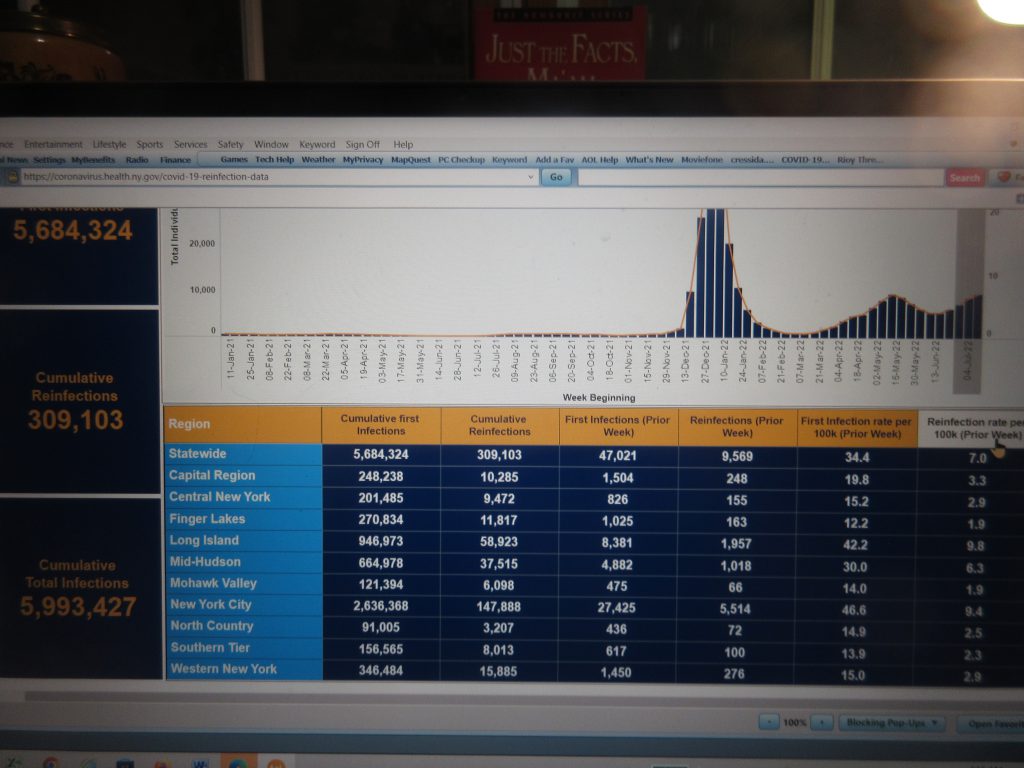
Let’s crunch some numbers of 5,684,324 First infections across the state the last 7 months and see what they say to us.
Across the state the last 7 months 5% of first infections or 309,103 that is 11,039 a week.
In the Mid-Hudson region, which has been climbing in infections the last two weeks we see 664,978 new infections the last 7 months, and 37,515 “Reinfections after 90 days” that is a 6% rate of reinfections.
The reinfection rate last week for the Mid-Hudson region was 1,018 on a population of 2.3 Million or 145 a day for a week. Meanwhile first infections in the Mid-Hudson region last week July 17-23 was 25 persons per day the average for the week . Now if they get reinfected in 90 days, at the rate of 6% this means more cases significantly in 3 months from now. Six percent of the 691 First time positives Saturday in 90 days would be 41 “Reinfections” in one day or an astounding 290 new “Reinfections” in a week in October in the first full month of school and holidays.
Let us apply that to the Westchester County totals for the week:
Westchester County averaged 36 new positives per for 1,004,000 people Saturday, 349 positives. If they are mild cases of covid and are cured, and they reinfect at the 6% rate by October, you will have 20 new Reinfections a day or 140 “reinfections” the week of October 13.
What this says to me is I have to be more careful.
What it says to you the parent of a school child or child under five is up to you.
What it says to you the adult who wants to forget about covid, you do so at your own risk.
What it says about the way the Department of Health does not count Antigen (at home tests), which I believe are connected to the consistent jumps in new infections on Tuesdays, Wednesdays Thursdays Fridays and Saturday days, I believe indicates the disease is infecting faster after these hot, sultry days and wonderful beach and crowd-drawing events. Just an observation, mind you, but you draw your own conclusions.
This reinfection data is disturbing.
Even with the apparently low 6% reinfection rate (the chart indicates) it multiplies daily by several hundred persons a week in the county the number of persons to care for, with the double edged covid effect of spreading the disease in the community.
It would be nice if the the Health Department explains what this means instead of leaving it up to us to figure out.
A 6% Reinfection Rate is not “low.”
We need to know how “high” the numbers of reinfections could be 3 months from today on a daily basis and how those reinfections will pile on to the medical load of new cases in October.
Please.