
Hits: 2065
WPCNR. CORONA VIRUS UPDATE FROM THE GOVERNOR’S PRESS OFFICE (Rearranged). January 3, 2021:
The Omicron variant comprised 90% of uploaded sequences from NYS between 12/20/21 and 1/2/22. This is actually slightly lower than the level reported yesterday, and reflects the expected fluctuations in the database with uploading batches of data from sequencing laboratories.
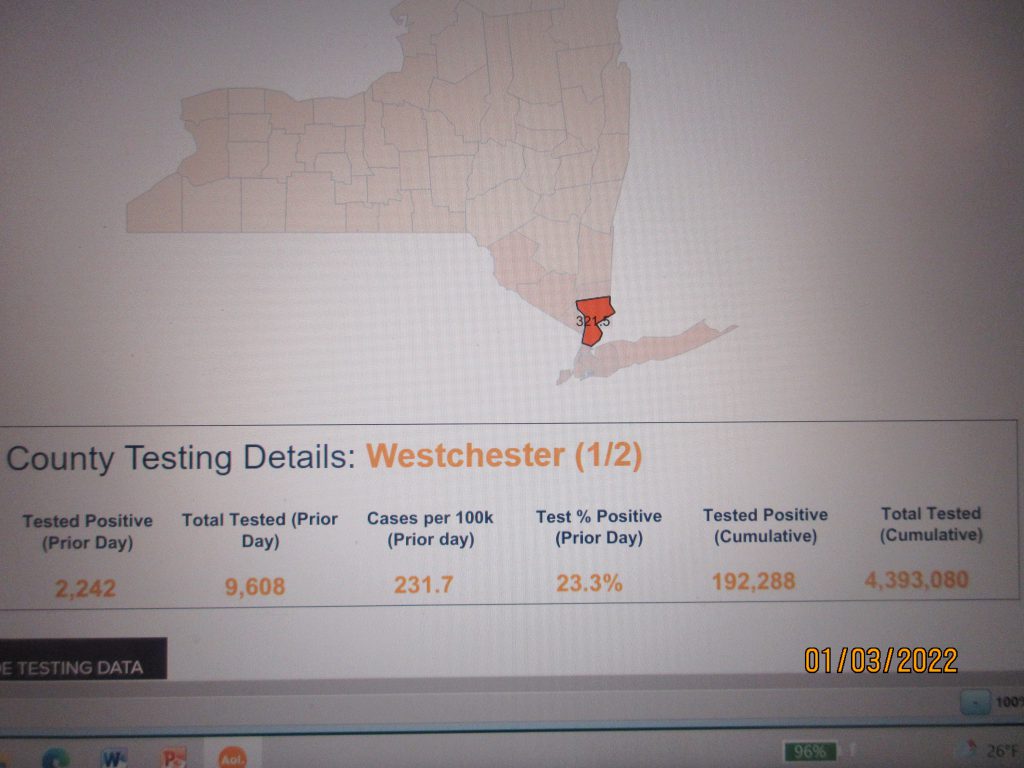
(Editor’s Note: Westchester County new positives on Friday numbered 2,242 of 9,608 tested, still 23% of those tested, but 758 below the 3,000 a day level on each of the last 5 days of 2021. More analysis of the trends across the Mid-Hudson 7 county region this evening.)
“Let’s celebrate the first day of school in 2022 by ensuring we are taking the proper precautions to keep them open through the rest of the year,” Governor Hochul said. “We know how to overcome this winter surge: Get the vaccine, get the booster, mask up, get tested and stay home if you’re feeling sick. If we don’t use these tools, many more in our communities will get sick.”
Today’s data is summarized briefly below:
- Test Results Reported – 223,153
- Total Positive – 51,698
- Percent Positive – 23.17%
- 7-Day Average Percent Positive – 21.49%
- Patient Hospitalization – 9,563 (+790)
- Patients Newly Admitted – 1,637
- Patients in ICU – 1,208 (+75)
- Patients in ICU with Intubation – 597 (+30)
- Total Discharges – 234,358 (+935)
- New deaths reported by healthcare facilities through HERDS – 103
- Total deaths reported by healthcare facilities through HERDS – 48,689
The Health Electronic Response Data System is a NYS DOH data source that collects confirmed daily death data as reported by hospitals, nursing homes and adult care facilities only. - Total deaths reported to and compiled by the CDC – 61,514
This daily COVID-19 provisional death certificate data reported by NYS DOH and NYC to the CDC includes those who died in any location, including hospitals, nursing homes, adult care facilities, at home, in hospice and other settings.
- Total vaccine doses administered – 33,793,621
- Total vaccine doses administered over past 24 hours – 26,814
- Total vaccine doses administered over past 7 days – 660,230
- Percent of New Yorkers ages 18 and older with at least one vaccine dose – 89.2%
- Percent of New Yorkers ages 18 and older with completed vaccine series – 80.6%
- Percent of New Yorkers ages 18 and older with at least one vaccine dose (CDC) – 95.0%
- Percent of New Yorkers ages 18 and older with completed vaccine series (CDC) – 82.9%
- Percent of all New Yorkers with at least one vaccine dose – 78.1%
- Percent of all New Yorkers with completed vaccine series – 69.8%
- Percent of all New Yorkers with at least one vaccine dose (CDC) – 84.0%
- Percent of all New Yorkers with completed vaccine series (CDC) – 71.8%
Each region’s 7-day average of cases per 100K population is as follows
| Region | Friday, December 31, 2021 | Saturday, January 1, 2022 | Sunday, January 2, 2022 |
| Capital Region | 123.60 | 139.86 | 155.07 |
| Central New York | 130.52 | 143.07 | 163.53 |
| Finger Lakes | 104.13 | 115.26 | 124.98 |
| Long Island | 348.88 | 374.87 | 398.82 |
| Mid-Hudson | 260.99 | 284.44 | 304.18 |
| Mohawk Valley | 105.94 | 116.60 | 126.49 |
| New York City | 419.08 | 439.23 | 457.73 |
| North Country | 74.60 | 84.42 | 92.85 |
| Southern Tier | 105.03 | 118.63 | 129.35 |
| Western New York | 139.32 | 151.13 | 171.53 |
| Statewide | 297.74 | 316.80 | 335.05 |
Each region’s 7-day average percentage of positive test results reported over the last three days is as follows:
| Region | Friday, December 31, 2021 | Saturday, January 1, 2022 | Sunday, January 2, 2022 |
| Capital Region | 14.56% | 15.45% | 16.12% |
| Central New York | 14.91% | 15.45% | 16.32% |
| Finger Lakes | 15.68% | 16.22% | 16.68% |
| Long Island | 22.69% | 24.16% | 24.94% |
| Mid-Hudson | 19.35% | 20.79% | 21.42% |
| Mohawk Valley | 12.58% | 12.84% | 13.22% |
| New York City | 20.56% | 21.69% | 22.31% |
| North Country | 11.94% | 12.43% | 12.88% |
| Southern Tier | 12.24% | 13.07% | 13.70% |
| Western New York | 16.42% | 17.13% | 17.95% |
| Statewide | 19.79% | 20.87% | 21.49% |
Each New York City borough’s 7-day average percentage of positive test results reported over the last three days is as follows:
| Borough in NYC | Friday, December 31, 2021 | Saturday, January 1, 2022 | Sunday, January 2, 2022 |
| Bronx | 25.50% | 26.86% | 27.63% |
| Kings | 19.42% | 20.58% | 21.13% |
| New York | 17.36% | 18.11% | 18.66% |
| Queens | 21.74% | 22.82% | 23.51% |
| Richmond | 21.44% | 22.84% | 23.25% |
Yesterday, 51,698 New Yorkers tested positive for COVID-19 in New York State, bringing the total to 3,669,264. A geographic breakdown is as follows:
| County | Total Positive | New Positive |
| Albany | 42,607 | 378 |
| Allegany | 7,058 | 35 |
| Broome | 34,536 | 240 |
| Cattaraugus | 11,647 | 35 |
| Cayuga | 11,718 | 96 |
| Chautauqua | 18,040 | 77 |
| Chemung | 15,492 | 108 |
| Chenango | 6,868 | 31 |
| Clinton | 10,259 | 89 |
| Columbia | 7,152 | 38 |
| Cortland | 7,495 | 51 |
| Delaware | 5,629 | 24 |
| Dutchess | 47,719 | 553 |
| Erie | 154,817 | 2,037 |
| Essex | 3,849 | 24 |
| Franklin | 6,594 | 45 |
| Fulton | 9,208 | 45 |
| Genesee | 10,377 | 45 |
| Greene | 6,319 | 33 |
| Hamilton | 638 | 3 |
| Herkimer | 10,362 | 49 |
| Jefferson | 13,524 | 87 |
| Lewis | 4,821 | 11 |
| Livingston | 8,691 | 55 |
| Madison | 9,357 | 51 |
| Monroe | 117,027 | 799 |
| Montgomery | 8,567 | 61 |
| Nassau | 313,601 | 5,195 |
| Niagara | 35,656 | 440 |
| NYC | 1,659,578 | 29,246 |
| Oneida | 40,185 | 187 |
| Onondaga | 73,874 | 953 |
| Ontario | 14,509 | 123 |
| Orange | 80,058 | 925 |
| Orleans | 6,547 | 14 |
| Oswego | 17,764 | 190 |
| Otsego | 6,762 | 29 |
| Putnam | 17,828 | 259 |
| Rensselaer | 21,915 | 207 |
| Rockland | 69,935 | 848 |
| Saratoga | 32,202 | 406 |
| Schenectady | 23,418 | 223 |
| Schoharie | 3,515 | 12 |
| Schuyler | 2,467 | 17 |
| Seneca | 4,078 | 29 |
| St. Lawrence | 15,407 | 37 |
| Steuben | 14,941 | 66 |
| Suffolk | 337,149 | 4,193 |
| Sullivan | 12,906 | 159 |
| Tioga | 7,873 | 46 |
| Tompkins | 11,932 | 44 |
| Ulster | 23,089 | 234 |
| Warren | 9,441 | 105 |
| Washington | 8,582 | 80 |
| Wayne | 12,585 | 55 |
| Westchester | 192,288 | 2,242 |
| Wyoming | 6,369 | 24 |
| Yates | 2,439 | 10 |
Given the rate of spread of Omicron, it is more meaningful to report the percentage of Omicron variants as reported to the public COVID-19 sequence databases, than to report counts of individual cases. This percentage can then be related to the total positive COVID case count in the state. This process is consistent with how the New York State Department of Health has reported on all other variants online: https://coronavirus.health.ny.gov/covid-19-variant-data
Data this morning in the GISAID database, the largest repository of SARS-CoV-2 sequences in the world, showC
It should be noted that similar data reported from the CDC, updated this week, uses a statistical model to project the variant percentages for a more recent timeframe. This projection approach partly explains the different percentage for the Omicron variant reported by CDC this week.
Yesterday, 103 New Yorkers died due to COVID-19, bringing the total to 48,689. A geographic breakdown is as follows, by county of residence:
| Deaths by County of Residence | |
| County | New Deaths |
| Albany | 2 |
| Allegany | 1 |
| Bronx | 15 |
| Broome | 2 |
| Chautauqua | 3 |
| Columbia | 1 |
| Dutchess | 1 |
| Erie | 4 |
| Franklin | 1 |
| Kings | 15 |
| Manhattan | 6 |
| Monroe | 1 |
| Nassau | 5 |
| Niagara | 1 |
| Oneida | 2 |
| Onondaga | 4 |
| Ontario | 1 |
| Orange | 1 |
| Queens | 10 |
| Rensselaer | 1 |
| Richmond | 1 |
| Rockland | 1 |
| Saratoga | 1 |
| Schenectady | 1 |
| Steuben | 1 |
| Suffolk | 8 |
| Tompkins | 1 |
| Ulster | 1 |
| Washington | 1 |
| Wayne | 4 |
| Westchester | 6 |
All New York State mass vaccination sites are open to eligible New Yorkers aged 12 years and older for walk-in vaccination on a first-come, first-serve basis, with 10 sites open to eligible New Yorkers aged 5 and older. People who would prefer to schedule an appointment at a state-run mass vaccination site can do so on the Am I Eligible App or by calling 1-833-NYS-4-VAX. People may also contact their local health department, pharmacy, doctor or hospital to schedule appointments where vaccines are available, or visit vaccines.gov to find information on vaccine appointments near them.
New Yorkers looking to schedule vaccine appointments for 5-11-year-old children are encouraged to contact their child’s pediatrician, family physician, county health departments, Federally Qualified Health Centers (FQHCs), rural health centers, or pharmacies that may be administering the vaccine for this age group. Parents and guardians can visit vaccines.gov, text their ZIP code to 438829, or call 1-800-232-0233 to find nearby locations. Make sure that the provider offers the Pfizer-BioNTechCOVID-19 vaccine, as the other COVID-19 vaccines are not yet authorized for this age group.
Visit our new website for parents and guardians for new information, frequently asked questions and answers, and resources specifically designed for parents and guardians of this age group.
Yesterday, 3,456 New Yorkers received their first vaccine dose, and 4,791 completed their vaccine series. A geographic breakdown of New Yorkers who have been vaccinated by region is as follows:
| People with at least one vaccine dose | People with complete vaccine series | |||
| Region | Cumulative Total | Increase over past 24 hours | Cumulative Total | Increase over past 24 hours |
| Capital Region | 941,020 | 336 | 856,845 | 324 |
| Central New York | 629,754 | 167 | 581,485 | 192 |
| Finger Lakes | 838,609 | 215 | 773,299 | 174 |
| Long Island | 2,090,999 | 263 | 1,846,695 | 805 |
| Mid-Hudson | 1,635,975 | 140 | 1,426,604 | 516 |
| Mohawk Valley | 316,980 | 91 | 293,155 | 325 |
| New York City | 7,651,163 | 1,750 | 6,697,712 | 1,926 |
| North Country | 294,626 | 70 | 265,551 | 68 |
| Southern Tier | 427,112 | 105 | 390,015 | 98 |
| Western New York | 925,531 | 319 | 844,250 | 363 |
| Statewide | 15,751,769 | 3,456 | 13,975,611 | 4,791 |
| Booster/Additional Shots | |||
| Region | Cumulative Total | Increase over past 24 hours | Increase over past 7 days |
| Capital Region | 360,928 | 1,325 | 23,520 |
| Central New York | 227,357 | 793 | 15,793 |
| Finger Lakes | 363,983 | 871 | 22,496 |
| Long Island | 689,393 | 3,356 | 52,071 |
| Mid-Hudson | 558,781 | 1,962 | 40,897 |
| Mohawk Valley | 124,745 | 323 | 8,004 |
| New York City | 1,737,079 | 4,489 | 175,899 |
| North Country | 106,112 | 314 | 7,309 |
| Southern Tier | 166,499 | 489 | 11,712 |
| Western New York | 404,823 | 1,248 | 23,902 |
| Statewide | 4,739,700 | 15,170 | 381,603 |
The COVID-19 Vaccine Tracker Dashboard is available to update New Yorkers on the distribution of the COVID-19 vaccine. The New York State Department of Health requires vaccinating facilities to report all COVID-19 vaccine administration data within 24 hours; the vaccine administration data on the dashboard is updated daily to reflect the most up-to-date metrics in the state’s vaccination effort. New York State Department of Health-reported data from NYSIIS and CIR differs slightly from federally-reported data, which is inclusive of federally-administered doses and other minor differences. Both numbers are included in the release above.