
Hits: 346
WESTCHESTER COUNTY STOPS REPORTING COVID NUMBERS;. 11 CONSECUTIVE WEEKS OF LOWER COVID INFECTIONS WEEK BY WEEK IN WESTCHESTER COUNTY ACCORDING TO STATE.
424 NEW COVID CASES LAST WEEK DOWN 22%. COVID INFECTIONS JAN-MARCH 4: 3,557
WPCNR CORONAVIRUS SURVEILLANCE. Statistics from NY State Covid Tracker & Hospitalization Tracker. Observation & Analysis by John F. Bailey March 7, 2023:
On his morning report on WVOX 1460 this morning, Westchester County Executive George Latimer announced the county would no longer be reporting covd numbers to the county, citing significant decline in new infections
New Lab-Validated Covid Cases in Westchester County declined 22% from 542 the week of Feb 19-25 to 424 in the week ended Saturday March 4. New covid-infected persons daily averaged 60 a day.
The week of Feb 26 through March 4 is the 11th consecutive week cases in Westchester have declined according to lab-verified positive case statistics, from a high of 10,000 at the close of the month of July, 2022. The decline in cases has been slow but steady.
In the 10 weeks since the start of the new year, Jan 1 through March 4, 3,557 persons tested positive for covid (lab-confirmed), an average of 356 a week.
At the current rate of 400 persons coming down with covid this projects to 1,600 persons a month in March. Since the school districts in the county stopped counting cases of covid, (being relieved of that responsibility by the New York State Department of Education), we do not have a handle on covid infections per school district, whether it is up down or under control.
Currently as of Friday, Westchester County was reported to have 4.3 new cases daily per 100,000 of population. Bear with me a moment: that is only lab-verified cases. If you test positive with a home test and do not get it verified via a lab test, your positive does not count in the daily totals
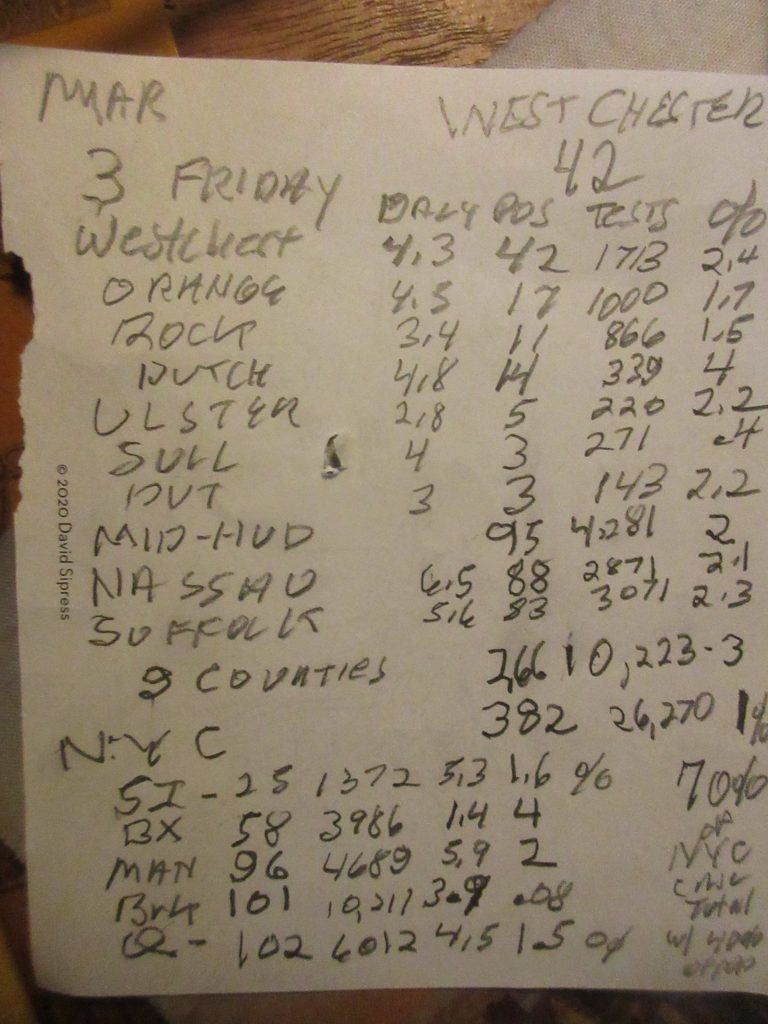
Westchester has 1,004,000 population, meaning you multiply 4.3 by 10.04 to get the real number of cases per day, 302, multiplied by 7 days gives our county 2,114 a week, or as many as 8,000 cases this coming month.
This says to me, Westchester County is getting 4 times as many cases a week than the lab-verified positive count is finding. Reducing the daily cases by counting them by 100,000 of population significantly lowers the daily Westchester count. The official thinking locally now is Westchester back to normal.
Even I, “Mr. Worry,” am being careless, not always masking when I go to Whole Foods or go out to eat. It’s perfectly understandable. But not smart on my decision making.
I tell you why I think this way: Hospitalizations.
In the Mid-Hudson Region of Westchester, Rockland, Orange, Dutchess, Ulster, Putnam and Sullivan Counties the daily hospitalization rate of new covid patients on March 2 was a 7 day average of 1.12 per 100 thousand people. Sounds great, right? It isn’t.
The Mid Hudson Valley Region has a population of 2, 363,622 persons, or 23.6 100,000 population increments.
To get a realistic handle of the spread of covid across the 7 counties, right now you have to multiply the region total by its 100,000 daily count over 7 days by 23.6.
So for the entire Mid-Hudson Valley average of 1.12/100,000 x 23.6 means last week on March 2, the Mid-Hudson Region all 7 counties reported actually 185 covid hospitalizations. (White Plains Hospital alone alone had 102 covid cases in 2 weeks of admissions , see totals at the end of this column. 185 covid hospitalizations for 7 counties has to be low. )
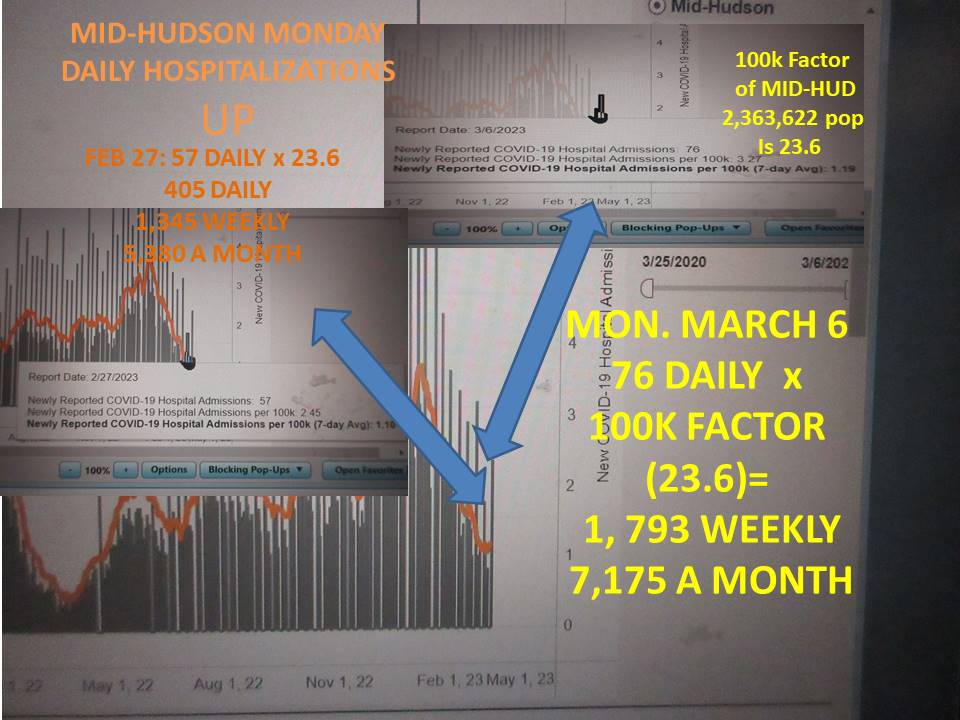
The Mid Hudson Region hospitalizations were higher two weeks ago:
One week prior to this week on February 27—the Mid-Hudson Region hospitals reported 2.45 new covid hospitalizations. Multiply that by 23.6 and the Mid Hudson region had 58 new covid hospitalizations in one day or 406 in week.
The average 7-day Mid Hudson average reported Feb 27 was 1.10 (multiply by 23.6) meaning the average hospitalizations for 7 days 2 weeks ago was 181. Reporting of daily case numbers per 100,000 (it is great to do this, but why not break it down and do the real math showing the actual figure per day?)
Multiplying the 7-day average out to a weekly projection as I have done, you see the 100,000 limitation applies attractive math cosmetics to the actual daily case/weekly rates, giving you the public, the authorities, state officials a false sense of security perhaps.
- New admissions and total hospitalization data come from the Health Electronic Response Data System (HERDS). Hospitals are required to complete this survey Monday through Friday and data reflects information reported by hospitals through the survey each day. These data include NYS resident and non-NYS resident hospitalizations.
- Health care facilities pause COVID-19 data submission through the Health Electronic Response Data System (HERDS) during weekends and certain holidays. Therefore, the dashboard will show no data for those dates. The first reporting date thereafter will contain those data and estimated 7-day averages are provided for all days.
At White Plains Hospital Medical Center, It is not normal.
In the last two weeks February 15 through March 3, covid hospitalizations at White Plains Hospital make up 50% of all new admissions.
WHITE PLAINS HOSPITAL MEDICAL CENTER
ADMISSIONS TOTALS FEB 15 THROUGH MARCH 3, 2023
DAY ADMISSIONS COVID % COVID
MAR 3 13 7 54%
MAR 2 14 8 57%
MAR 1 21 10 48%
FEB 28 19 9 47%
FEB 24 21 9 43%
FEB 23 22 14 64%
FEB 22 21 10 48%
FEB 21 26 11 42%
FEB 17 19 10 53%
FEB 16 21 6 30%
FEB 15 20 8 40%
16 DAYS
ADMISSIONS
TOTALS 217 102 47%
Bottom Line as Dr. Katelyn Jetelina would say, how many more people are there out there possibly hospitalized this week because the covid they have that is making them sicker and sicker they were thinking was, “If I am positive, and I cannot work, I can’t admit I’m positive,” that is the only explanation for such obvious more cases than the official daily rates would indicate.
The Mid-Hudson region is could be on an upswing in hospitalizations.
White Plains Hospital continues to see a recurrence of covid cases being about half its care load.
These number observations may also indicate that the disease is not as easy to get over as people may think it is.