
Hits: 177
|
 |
Si quiere leer la versión en español, pulse aquí.
State of Affairs: Feb 6
Still a lot of sickness out there, marking the longest respiratory season since the beginning of the pandemic.
REPRINTED WITH PERMISSION |
|
|
|||||||||||||||
After a few weeks of nosediving, things are, unfortunately, stabilizing. Does it feel like this respiratory season is never-ending? That’s because this is the longest respiratory season since the beginning of the pandemic.
Here is your state of affairs.
Influenza-like illnesses: High and plateauing
The climate of respiratory health in the United States (coined “influenza-like illnesses” by CDC) remains above the epidemic threshold and has plateaued due to children returning to school after the holidays.
We are going into our 13th week of being above “epidemic” levels. Last year, our entire season was 11 weeks. (The year before was 7 weeks). It’s looking more and more like “pre-pandemic” times, where we had ~15-18 weeks of illness during the winter.
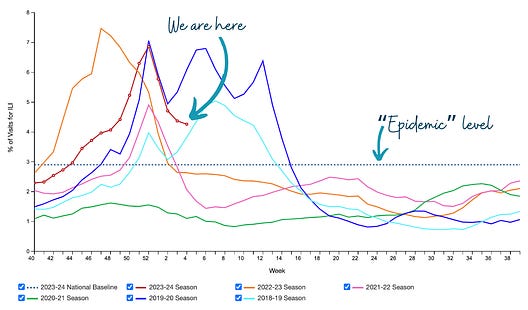 |
Outpatient Respiratory Illness Visits (Source: CDC; Annotated by YLE)
Covid-19 still takes the cake for respiratory deaths. By how much? We don’t know yet. The data below are from death certificates, which are pretty accurate for Covid and RSV but not for flu. CDC annually adjusts flu deaths post-hoc to account for underreporting. We must wait to see how those calculations play out.
 |
Trends in Viral Respiratory Deaths in the United States (Source: CDC; Annotated by YLE)
Covid-19: High and… stabilizing?
Nationally, Covid-19 in wastewater is still “high.” Unfortunately, levels have stabilized in all regions except the South, where exponential growth started again. This could be a “noise” signal due to unstable reporting or a “real” signal due to, perhaps, it getting colder later in the South.
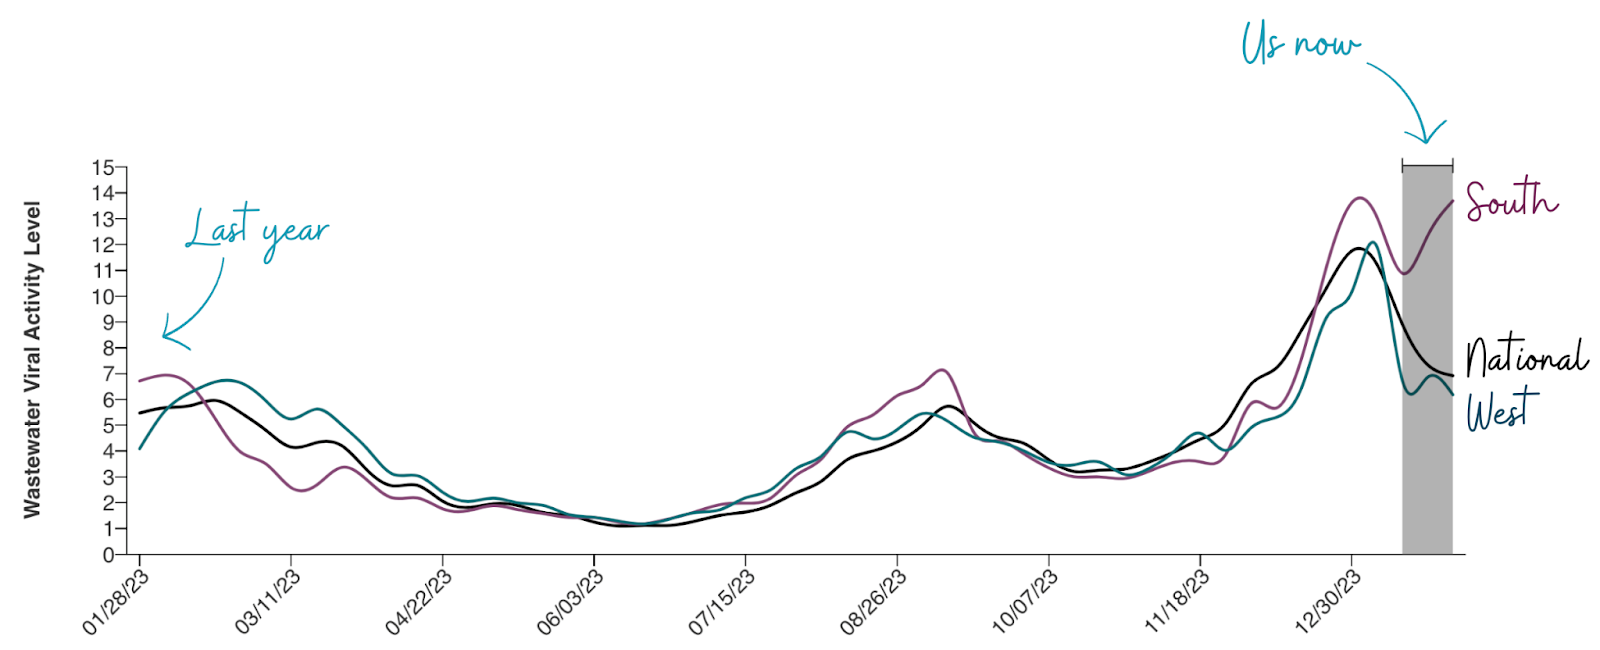 |
Wastewater SARS-CoV-2 viral activity level on a national level (Source: CDC; Annotations by YLE)
Covid-19 hospitalizations are slowing down, too, after a few weeks of nosediving. Are Covid-19 hospitalizations higher than flu? Well… it depends on which CDC graph you look at, which is confusing. The top graph below shows Covid-19 hospitalizations winning while the bottom shows flu winning.
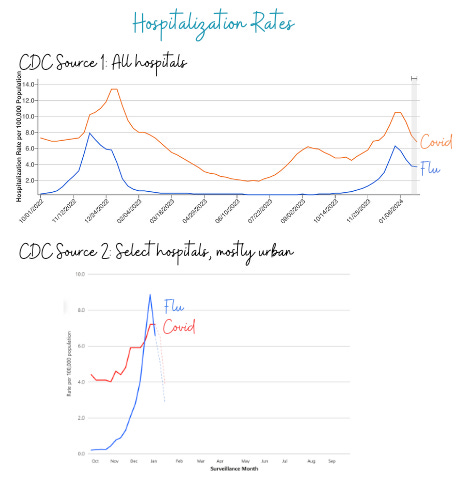 |
(Top) Covid-19 and Influenza Hospitalization Rates (Source: CDC) (Bottom) Weekly Rates of Respiratory Virus-Associated Hospitalizations by Season (Source: CDC); Annotated by YLE
Why the different data stories? The sources are different. The top graph is from all hospitals mandated to report due to the pandemic, and the bottom is a few hospitals representing only 10% of the population from mostly urban areas. This is probably causing two things to happen:
- Vaccine effect. Urban places have more Covid-19 vaccinated than rural; thus Covid-19 hospitalizations are lower on the bottom graph than the top.
- Case definition differences may be happening. The data in the top graph is reported by hospitals, which may differ from the bottom graph, reported by a review of lab records.
I trust the top graph more. Unfortunately, this data story will stop in April because the reporting mandate is ending. Hospitals hate reporting this metric, but if you ask me, I don’t care. We need this data.
Flu: High and stabilizing
Influenza is still surging. Emergency department visits for flu increased due to one particular group: 5-17 year olds.
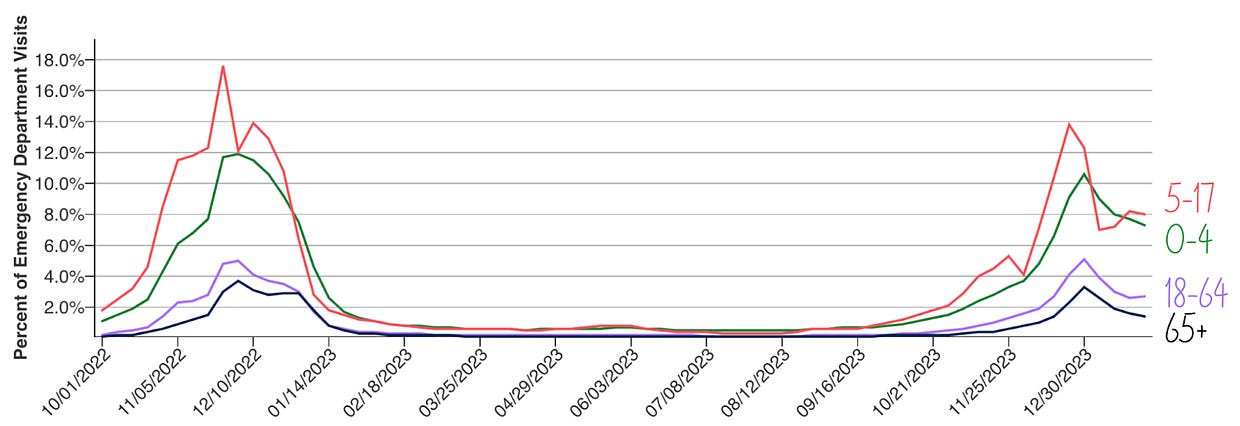 |
Percent of Emergency Department Visits for Flu, by age. (Source CDC; Annotated by YLE)
RSV: Moderate but nosediving
RSV continues to go down and down. Good riddance.
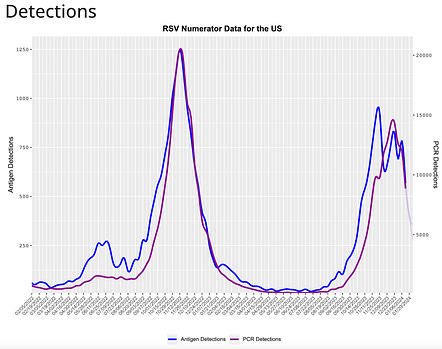 |
(Source: CDC)
Other things I’m paying attention to:
- New CDC data show that the 2023 fall Covid-19 vaccines provide 54% increased protection against infection. In other words, fall Covid vaccines were a good call. A few more thoughts of mine are here.
- Norovirus (think throwing up and diarrhea) has been a rollercoaster, but is now increasing quickly. Historically, this is about the time that norovirus takes off. Wash those hands.
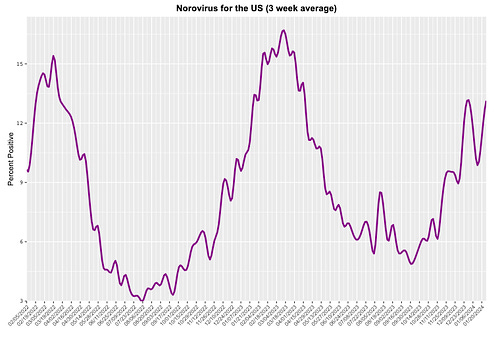 |
(Source: CDC)
Bottom line
We are still very much in the middle of the “feeling crappy” season. And, unfortunately, it’s already longer than last year’s. Hopefully we get a reprieve in the next month or two.
Love, YLE
“Your Local Epidemiologist (YLE)” is written by Dr. Katelyn Jetelina, M.P.H. Ph.D.—an epidemiologist, wife. During the day, she is a senior scientific consultant to several organizations, including CDC. At night, she writes this newsletter. Her main goal is to “translate” the ever-evolving public health world so that people will be well-equipped to make evidence-based decisions. This newsletter is free, thanks to the generous support of fellow YLE community members. To support this effort, subscribe below: