
STATE OF AFFAIRS FEB 6–FROM YOUR LOCAL EPIDEMIOLOGIST– DR. KATELYN JETELIA
|
 |
Si quiere leer la versión en español, pulse aquí.
State of Affairs: Feb 6
Still a lot of sickness out there, marking the longest respiratory season since the beginning of the pandemic.
REPRINTED WITH PERMISSION |
|

|
|||||||||||||||
After a few weeks of nosediving, things are, unfortunately, stabilizing. Does it feel like this respiratory season is never-ending? That’s because this is the longest respiratory season since the beginning of the pandemic.
Here is your state of affairs.
Influenza-like illnesses: High and plateauing
The climate of respiratory health in the United States (coined “influenza-like illnesses” by CDC) remains above the epidemic threshold and has plateaued due to children returning to school after the holidays.
We are going into our 13th week of being above “epidemic” levels. Last year, our entire season was 11 weeks. (The year before was 7 weeks). It’s looking more and more like “pre-pandemic” times, where we had ~15-18 weeks of illness during the winter.
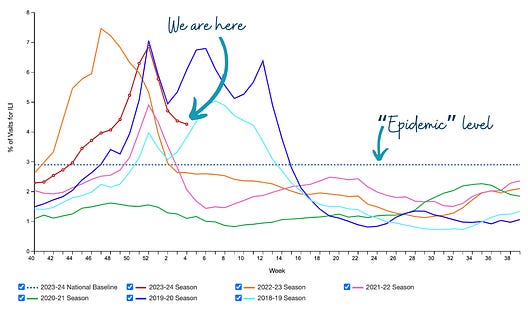 |
Outpatient Respiratory Illness Visits (Source: CDC; Annotated by YLE)
Covid-19 still takes the cake for respiratory deaths. By how much? We don’t know yet. The data below are from death certificates, which are pretty accurate for Covid and RSV but not for flu. CDC annually adjusts flu deaths post-hoc to account for underreporting. We must wait to see how those calculations play out.
 |
Trends in Viral Respiratory Deaths in the United States (Source: CDC; Annotated by YLE)
Covid-19: High and… stabilizing?
Nationally, Covid-19 in wastewater is still “high.” Unfortunately, levels have stabilized in all regions except the South, where exponential growth started again. This could be a “noise” signal due to unstable reporting or a “real” signal due to, perhaps, it getting colder later in the South.
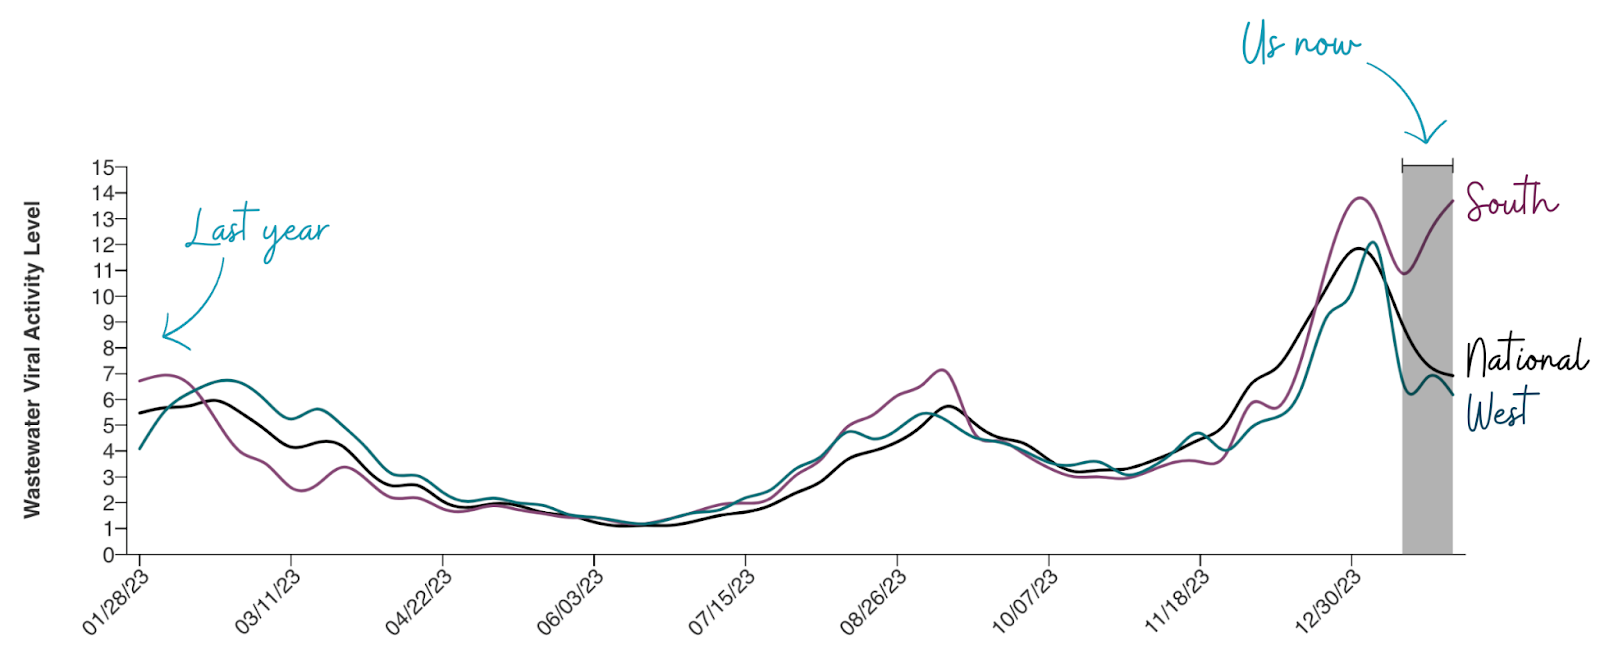 |
Wastewater SARS-CoV-2 viral activity level on a national level (Source: CDC; Annotations by YLE)
Covid-19 hospitalizations are slowing down, too, after a few weeks of nosediving. Are Covid-19 hospitalizations higher than flu? Well… it depends on which CDC graph you look at, which is confusing. The top graph below shows Covid-19 hospitalizations winning while the bottom shows flu winning.
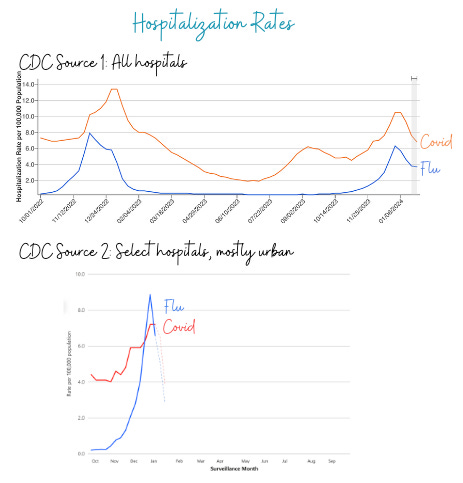 |
(Top) Covid-19 and Influenza Hospitalization Rates (Source: CDC) (Bottom) Weekly Rates of Respiratory Virus-Associated Hospitalizations by Season (Source: CDC); Annotated by YLE
Why the different data stories? The sources are different. The top graph is from all hospitals mandated to report due to the pandemic, and the bottom is a few hospitals representing only 10% of the population from mostly urban areas. This is probably causing two things to happen:
- Vaccine effect. Urban places have more Covid-19 vaccinated than rural; thus Covid-19 hospitalizations are lower on the bottom graph than the top.
- Case definition differences may be happening. The data in the top graph is reported by hospitals, which may differ from the bottom graph, reported by a review of lab records.
I trust the top graph more. Unfortunately, this data story will stop in April because the reporting mandate is ending. Hospitals hate reporting this metric, but if you ask me, I don’t care. We need this data.
Flu: High and stabilizing
Influenza is still surging. Emergency department visits for flu increased due to one particular group: 5-17 year olds.
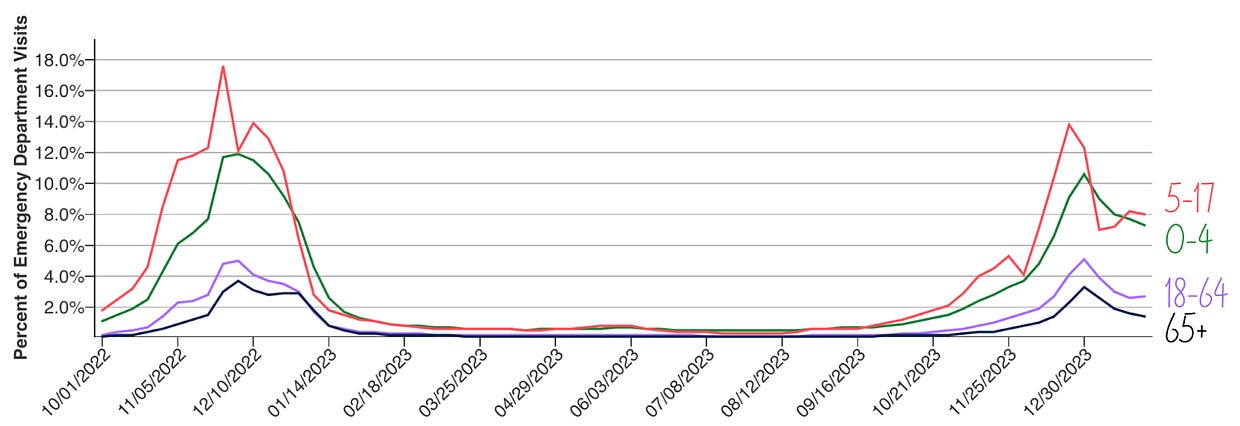 |
Percent of Emergency Department Visits for Flu, by age. (Source CDC; Annotated by YLE)
RSV: Moderate but nosediving
RSV continues to go down and down. Good riddance.
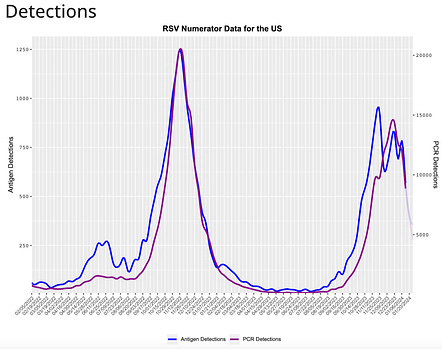 |
(Source: CDC)
Other things I’m paying attention to:
- New CDC data show that the 2023 fall Covid-19 vaccines provide 54% increased protection against infection. In other words, fall Covid vaccines were a good call. A few more thoughts of mine are here.
- Norovirus (think throwing up and diarrhea) has been a rollercoaster, but is now increasing quickly. Historically, this is about the time that norovirus takes off. Wash those hands.
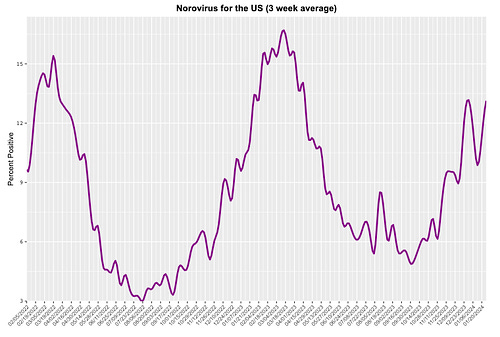 |
(Source: CDC)
Bottom line
We are still very much in the middle of the “feeling crappy” season. And, unfortunately, it’s already longer than last year’s. Hopefully we get a reprieve in the next month or two.
Love, YLE
“Your Local Epidemiologist (YLE)” is written by Dr. Katelyn Jetelina, M.P.H. Ph.D.—an epidemiologist, wife. During the day, she is a senior scientific consultant to several organizations, including CDC. At night, she writes this newsletter. Her main goal is to “translate” the ever-evolving public health world so that people will be well-equipped to make evidence-based decisions. This newsletter is free, thanks to the generous support of fellow YLE community members. To support this effort, subscribe below:
SOCIAL MEDIA AND TEEN MENTAL HEALTH: YOUR LOCAL EPIDEMIOLOGIST EXPLAINS
 |
Si quiere leer la versión en español, pulse aquí.
Social media and kids’ mental health- An update
The public health datastory behind the congressional hearing
Reprinted with permission. |
|
|||||||||||||||
Public health touches all aspects of our lives, not just during a pandemic and not just with infectious diseases. Thanks to your feedback, this newsletter will continue with Covid-19 updates and address other public health topics, like mental health. To choose what topics land in your inbox, click HERE.
Strong bipartisan statements came out of a congressional hearing yesterday about the harms of social media use among children and teens. Parents of kids harmed by social media showed up in immense force.
“You have blood on your hands.”— Sen. Lindsey Graham to five social media CEOs.
“I’m sorry for everything you have all been through.”— Mark Zuckerberg to parents in the audience.
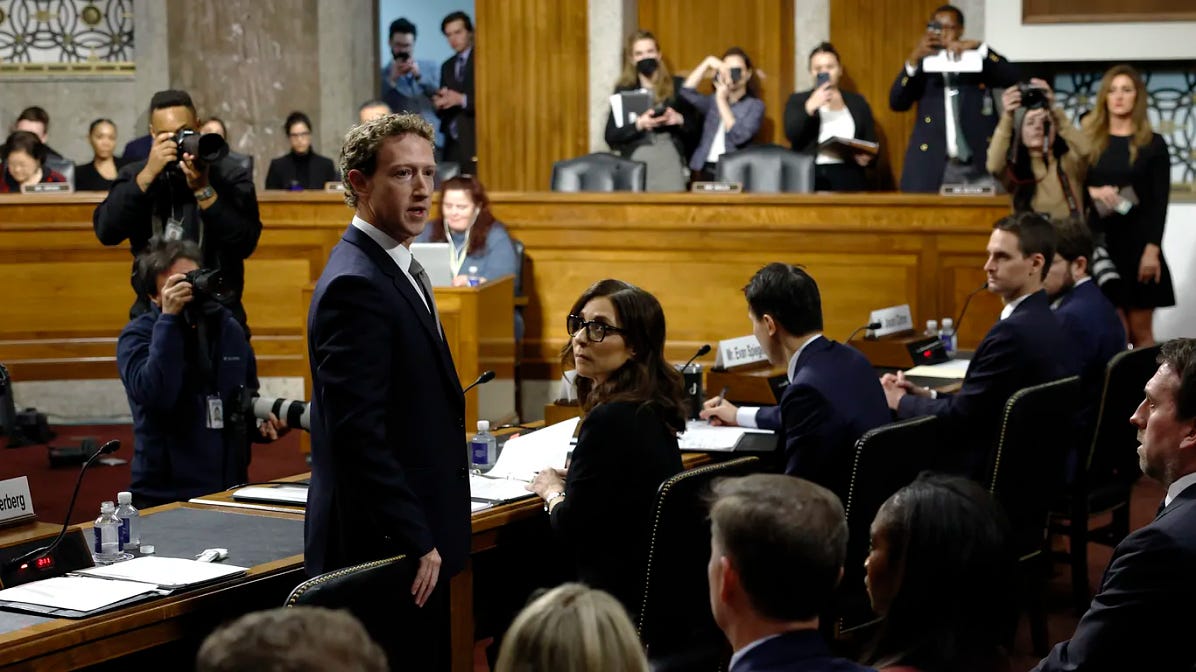 |
Meta CEO Mark Zuckerberg speaks directly to audience members of a Senate Judiciary Committee hearing on the dangers of child sexual exploitation on social media. Photo: Anna Moneymaker/Getty Images)
Is social media dangerous for children and teens? And, if so, what are our options?
Here is the nuanced public health data that (hopefully) congressmen/women are using to (hopefully) make meaningful and needed change. But, as we know by now, policy isn’t always based on science.
Note: The below was published 8 months ago, and some things have changed since. We bolded the changes to bring you along for the ride. As a parent, I still root for Option #4.
Love, YLE
Mental health and social media among teens |
||||||
|
||||||
 |
||||||
|
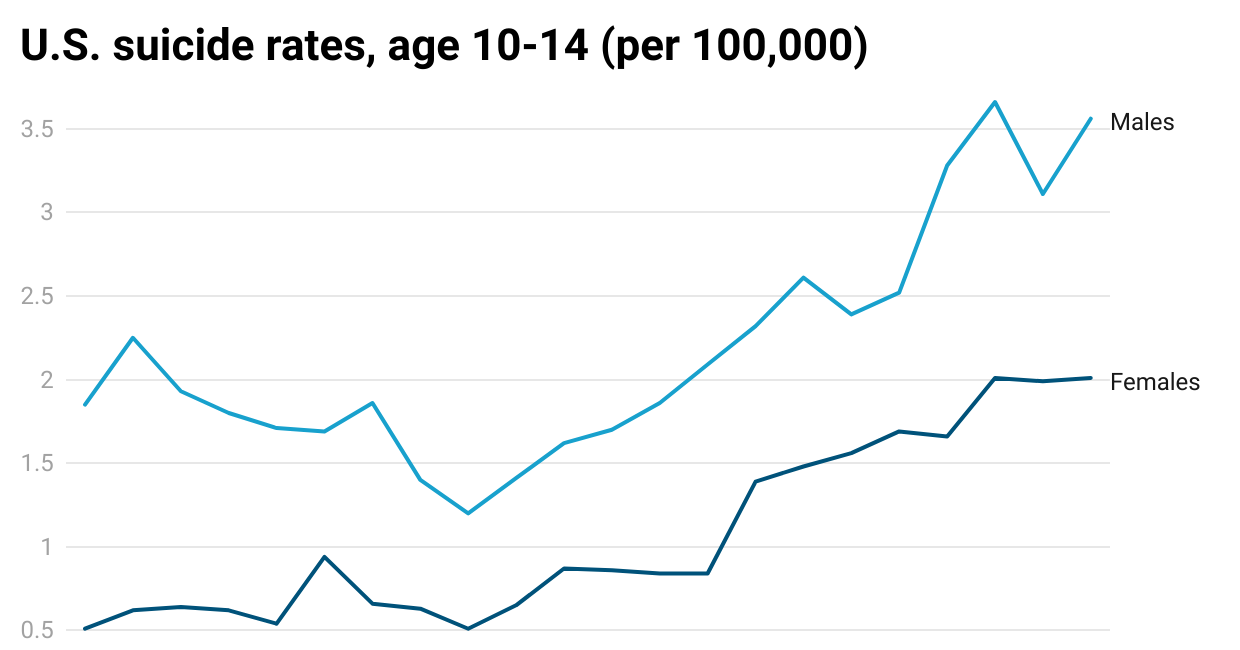
Protecting youth from the potential negative mental health effects of social media is front and center in the mass media, in conversations around dinner tables, and in federal- and state-level bills. Is the teen mental health crisis a real thing? This post contains sensitive information, including a discussion of suicide. If you are in need of help, there is an abundance of resources on the National Suicide Prevention Hotline website, which includes an anonymous chat function and a direct line at 800-273-8255. Protecting youth from the potential negative mental health effects of social media is front and center in the mass media, in conversations around dinner tables, and in federal- and state-level bills. Is the teen mental health crisis a real thing?Yes. Rates of mental health problems have continually increased among young people over the past 15 years, regardless of how you measure it: In 2021, 42% of U.S. high school students reported “persistent feelings of sadness or hopelessness,” up from 28% in 2011. The increase was especially dramatic among girls.  According to diagnostic measures (structured interviews by a trained professional), depression has increased 7.7% in U.S. teens—and 12% among girls—between 2009 and 2019. According to U.S. death certificates, suicide rates among youth ages 10-14 increased 139% for girls and 70% for boys since 2012. However, this is a bit difficult to interpret given low the rates to begin with for girls.  (The trends are increasing fast among teens. But, for perspective, the rates of suicide are significantly higher in adults.)  Is this rise due to social media?Teens use social media. A lot. Almost one in five teens use YouTube “almost constantly.” Nearly half of teens use TikTok (48%) and Snapchat (44%) several times per day. And the total hours of use have increased in recent years among teens.  But using social media doesn’t necessarily equate to mental health problems. Correlation doesn’t always equal causation. And, to make things more complicated, there are harms and benefits of social media. Harms of social mediaWe have a lot of correlational evidence, and some—but not much—causal evidence of the harms of social media on teens’ mental health. Correlational studies ask teens how much time they’re spending on social media, and ask them about mental health. In general, these point to weak but statistically relevant correlations between social media use and lower teen well-being. In terms of causal evidence, we have a couple of studies:
What is clear is that we need more research with more rigorous designs. Benefits of social mediaCompeting with these harms are studies that show social media has benefits for mental health, too. Teens report that social media is important for:
These benefits can be especially important for those who may be socially vulnerable in their offline lives, like LGBTQ+ youth. What else could explain it?Assessing causality means understanding what other factors may also explain the rise of mental illness among teens. A few alternative explanations have been proposed:
Of course, many of these explanations may be intertwined with and amplified by social media, but the short answer is that we likely can’t blame social media alone. Mental health is complicated, and there is unlikely to be a single, simple explanation for a large-scale phenomenon like this one. So, what should we do about it?We’ve got a few options:
Bottom lineWe have some evidence that social media is playing a role in the teen mental health crisis, but that evidence is not definitive. And social media can play a positive role, too. It is highly unlikely that social media is the only cause of mental illness among children. We can certainly take steps to make social media a healthier place, but if we truly want to support teens’ mental health, this is only the start. Love, YLE and JN
|
||||||
|


ALL NEW WHITE PLAINS WEEK THE FEBRUARY 2ND REPORT ON WWW.WPCOMMUNITYMEDIA.ORG

JOHN BAILEY AND THE NEWS YOU NEED TO KNOW
THIS WEEK, EVERY WEEK ON WHITE PLAINS WEEK FOR 22 YEARS


TOM SOYK ON SPEED LIMITS

$1,000 DOLLARS AND UP CON ED BILLS AS CITIZENS WITH NATURAL GAS IN WHITE PLAINS ARE BEING HEATED OUT OF THEIR HOMES, LIVELIHOOD AND THE STATE DOES NOTHING, WHISTLES BY THE GRAVEYARD.
44% INCREASE SINCE DECEMBER. THE STORY OF THE STATE SELL OUT TO BIG POWER, LEADERS STAY SILENT ABOUT IT. NO MEDIA IS TALKING ABOUT, BUT WPW IS TELLING ABOUT IT~! SOMEBODY’S GOT TO DO IT.


DEVELOPMENT OF GOOD COUNSEL APARTMENTS COMES BACK TO THE COUNCIL

ATTORNEY WILLIAM NULL ON THE NEW SITE PLAN FOR 52 NORTH BROADWAY-WHAT’S AHEAD
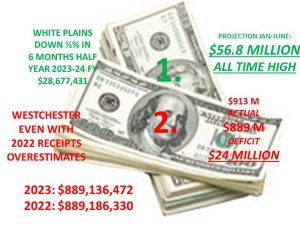
WHITE PLAINS SALES TAXES ON TARGET FOR RECORD BUT DOWN 1/2%
WESTCHESTER COUNTY EVEN BUT BLOWS SALES TAX FORECAST AGAIN–FACES $24 MILLION DEFICIT. WHERE’S THE LIFT FROM INFLATION? WHERE IS IT? THE WESTCHESTER AND WHITE PLAINS ECONOMIES ARE FLAT

PART TWO OF JOHN BAILEY’S PREVIEW OF THE SECOND HALF OF THE DRAFT ONEWHITEPLAINS PLAN
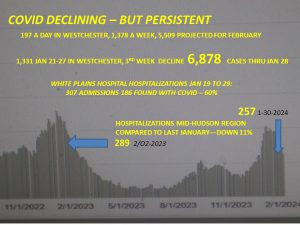
THE STATE OF COVID DECLINING BUT VERY SLOWLY

THIS WEEK ON “PEOPLE TO BE HEARD” AT 7 SATURDAY NIGHT, CH 45 FIOS AND CH 76 OPTIMUM AND www.wpcommunitymedia.org
A REBROADCAST OF COMMISSIONER DAVID CHONG’S FENTANYL REPORT
IN WESTCHESTER COUNTY, WHY IT IS SO DANGEROUS. A TIMELY REVIEW IN LIGHT OF OREGON DECLARATION OF A 90 DAY EMERGENCY because of fentanyl deaths fro overdoses.