WHITE PLAINS WESTCHESTER DAILY NEWS SERVICE VISITS SINCE 2000 A.D. 25TH YEARl REPORTING THE NEWS YOU NEED TO KNOW News Service Since 2000 A.D. 2026 WILL BE OUR 26TH YEAR OF COVERING WHITE PLAINS NEW YORK USA . John F. Bailey, Editor (914) 997-1607 wpcnr@aol.com Cell: 914-673-4054. News Politics Personalities Neighborhoods Schools Finance Real Estate Commentary Reviews Policy Correspondence Poetry Philosophy Photojournalism Arts. The WHITE PLAINS CITIZENETREPORTER. TELEVISION: "White Plains Week" News Roundup, 7:30 EDT FRI, 7 EDT MON & the incisive "People to Be Heard" Interview Program 8PM EDT THURS, 7 PM EDT SAT on FIOS CH 45 THROUGHOUT WESTCHESTER AND, ALTICE OPTIMUM WHITE PLAINS CH 1300 Fighting for Truth, Justice and the American Way. TOP 10 VISITORS FROM AROUND THE WORLD :1. USA. 2.BRAZIL3.VIET NAM 4. CHINA 5. JAPAN 6.UK. 7.CANADA. 8.INDIA. 9.AUSTRALIA 10.IRELAND 11.GERMANY 12..ARGENTINA 13.BANGLADESH 14.RUSSIA. 15.NEWZEALAND. 16. FRANCE. 17.MEXICO. 18.UKRAINE. 19.SOUTH AFVRICA. 20. IRAQ.
WPCNR ON THE CORNAVIRUS TRAIL. By John F. Bailey July 10, 2022.:
Saturday new new infections in Westchester County totaled 259 in Lab positive confirmed testings bring the county total to 2,327 for the week.
New cases surged the first three days of the week above last week’s first three days and continue the mid week patter of positives doubling by Wednesday and Thursday and Friday which has been consistent the last 5 weeks. This indicates persons’ weekend activities are causing them to get sick within 1 to 2 days after the weekend socializing activities,and testing themselves or going to a testing center and having a testing labconfirm their positiveness. We cannot know how fast they are getting infected but the midweek consistent surging in positives in the County would indicate that is the case.
New positives ran 332 new positives a day for the 7 days July 3 through 9. an infection rate of 11% of those tested. Average testing per day was 3,000 a day, very low historically. There 20,854 tests analyzed by state labs in Westchester County last week.
FIGURES UNDERESTIMATE WESTCHESTER COVID INFECTIONS NUMBERS BY 38,466, NEW INFECTIONS BY 500 A WEEK— UNDERESTIMATES PEOPLE AT RISK FOR COVID NEW INFECTIONS BY THOUSANDS. 4TH UP-INFECTION WEEK IN 5 WEEKS OF HIGHER POSITIVES FOR WESTCHESTER
WPCNR CORONAVIRUS TRAIL.By John F. Bailey. July 10, 2022:
If you knew how many persons lived in Westchester a year ago by the 2020 census, wouldn’t you assume the government and the state would adjust their calculations about covid based on the current populations of Westchester and every other county in the country?
They are not.
The first weekly report issued last week by the Center for Disease Control is using 2010 Census Data.
The CDC report was reported a month ago by the Governor’s office of New York as updating the CDC format and put out the first edition last week.
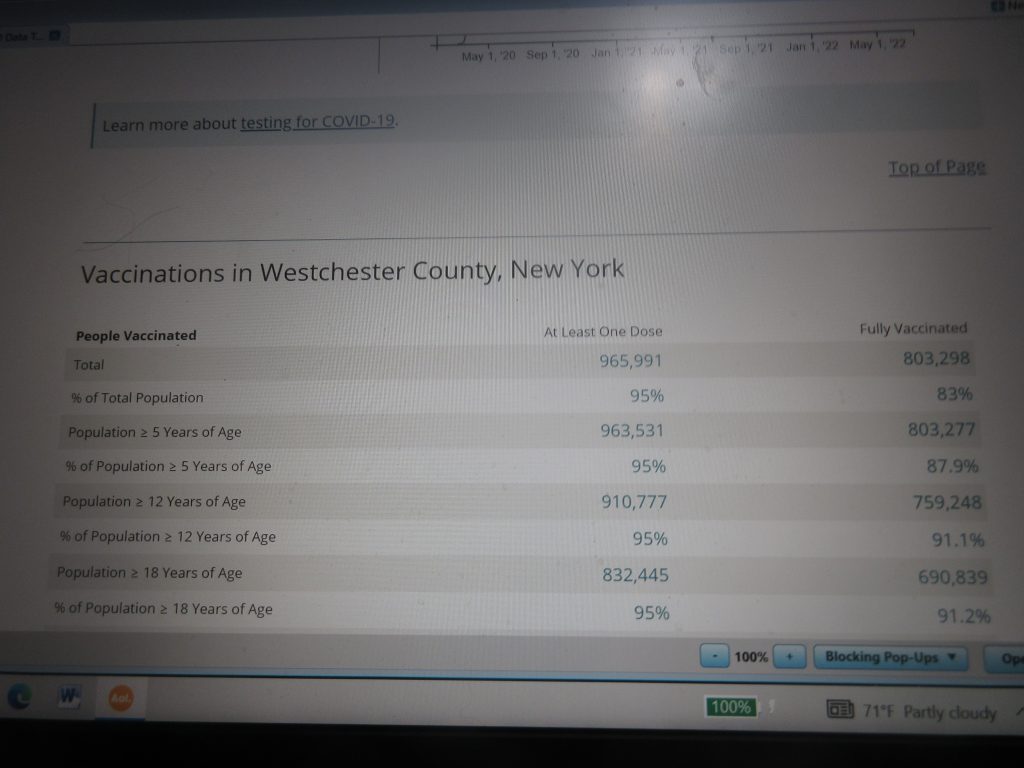
Westchester’s population is reported as 965,991. According to the 2020 census figure released one year ago it is 1,004,457. That is a 38,466 more persons in Westchester County, than the CDC and the Covid Tracker of NY are using.
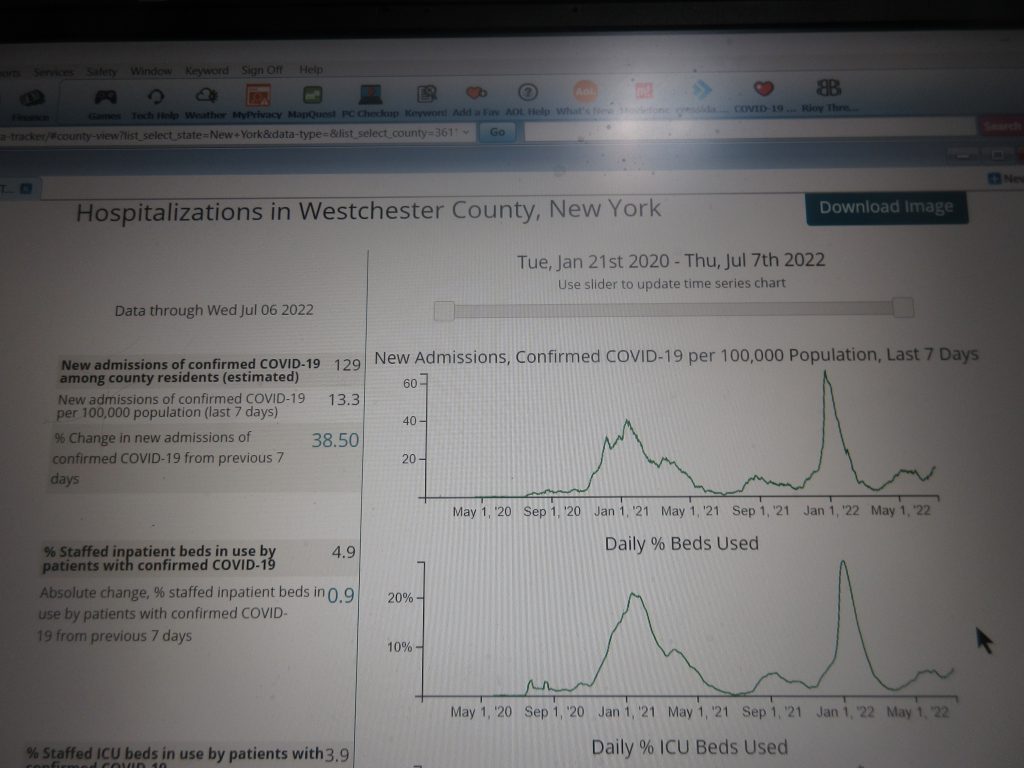
The implication of this is that the new infections, across the country are being under-reported by millions. In Westchester County they are under reported in the number CDC of new infections a week, 158 per 100,000 population per week. Let’s take a look.
In the last six days, July 3 through Friday, July 6 with Saturday’s figures from the New York State Covid Tracker to come out today, Sunday, means Westchester if we have the same number of infections we had last Saturday (July 2- 247)) will have 2,315 new covid infections, compared to 2077 last week June 25 to July 2. That will make the third consecutive week of covid increases and 4th 300 a day week in the last 5.
According to the Center for Disease Control first new weekly report of July Westchester County is infecting at the rate of 158 persons a week per 100,000 population every 7 days. If you multiply that by 10.04 (Westchester’s new population as of last spring, 2021 was 1,004,457), you get 10.04 x 158 that estimates Westchester should have 1,586 new infections this week.
We don’t.
The last six days show we already have 2,068.
We have been averaging over 2,000 a week, 300 a day. Four of the last 5 weeks.
This discrepancy indicates a lag in getting figures from the states to the CDC, or at least New York State.
When the New York State Covid Tracker debuted they used the former figures from 2010, because they were the only census available. But now we have had the new numbers for every county in New York (and nationwide), for 2 years.
When I figured vaccinations for New York State when they started last January, I used the new population figure, 1,004,457, to judge the gap between fully vaccinated persons with one dose, and persons not vaccinated.
The CDC, using the 965,991 figure, inadvertently probably, gives a false sense of safety. Take a look at their chart:
Why wouldn’t the CDC and the New York Covid Tracker update the population bases by county?
Why wouldn’t the CDC and the New York Covid Tracker update them to provide more accurate presentation vaccination figures based on the true population of the moment?
JOHN BAILEY AND THE NEWS THIS WEEK EVERY WEEK FOR 21 YEARS ON WHITE PLAINS WEEK
JOHN MARINO AND THE NEWS THE VOICE OF NEW YORK FROM WESTCHESTER TALK RADIO GUEST ANCHOR THIS WEEK . THE ANCHORS OF WESTCHESTER ON THE NEWS YOU NEED TO KNOW100 HOMES PROPOSED FOR OLD RIDGEWAY GOLF CLUB –WESTCHESTER’S LARGEST SUBDIVISION EVER.
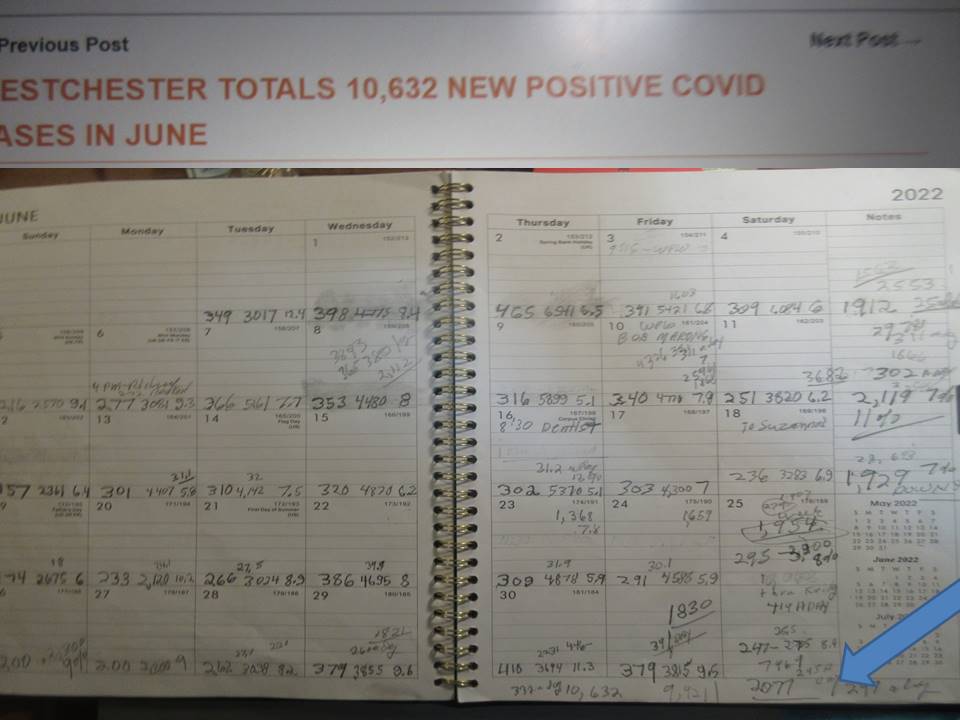
WESTCHESTER COUNTY TOPS 10,000 NEW CASES OF COVID IN JUNE– THREATENS A RED COVID SUMMER IN JULY AUGUST.
ALL YOU NEED TO KNOW ABOUT THE PRIMARIES JUST COMPLETED. WINNERS LOSERS AND THE LINE UP FOR THE AUGUST CONGRESSIONAL PRIMARIES–FROM ROVING POLITICAL ANALYST JOHN MORINOTHE ISSUES IN THE BATTLE FOR POWER IN THE STATE COMING UP!REAL ESTATE SALES 2ND QUARTER N THE GOLDEN APPLE–NOT SO GOLDEN– THE ANCHORS SORT IT OUT
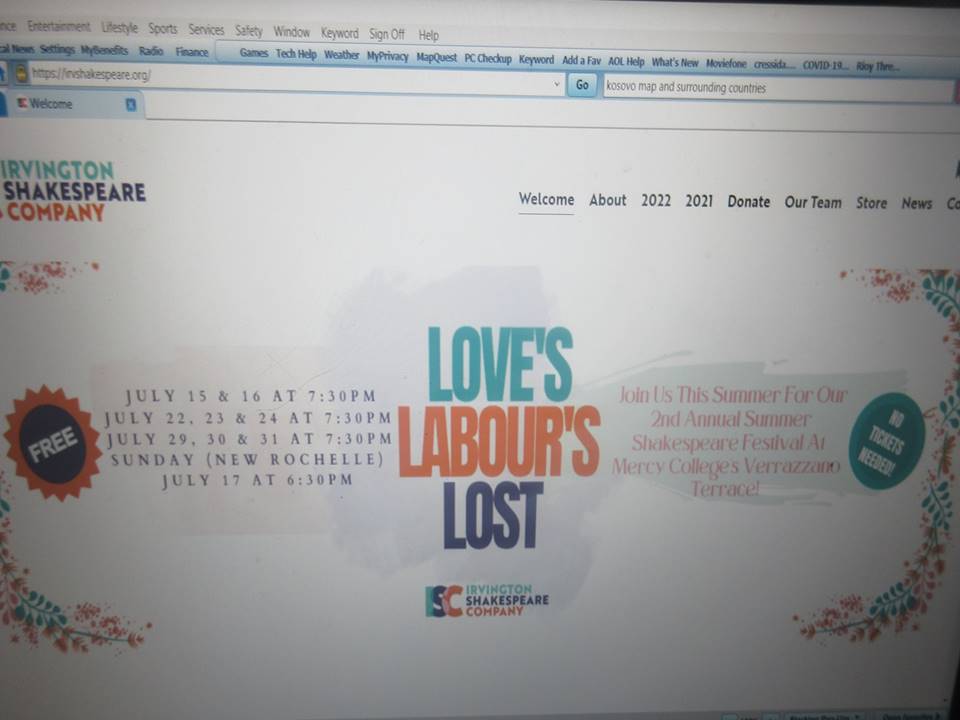
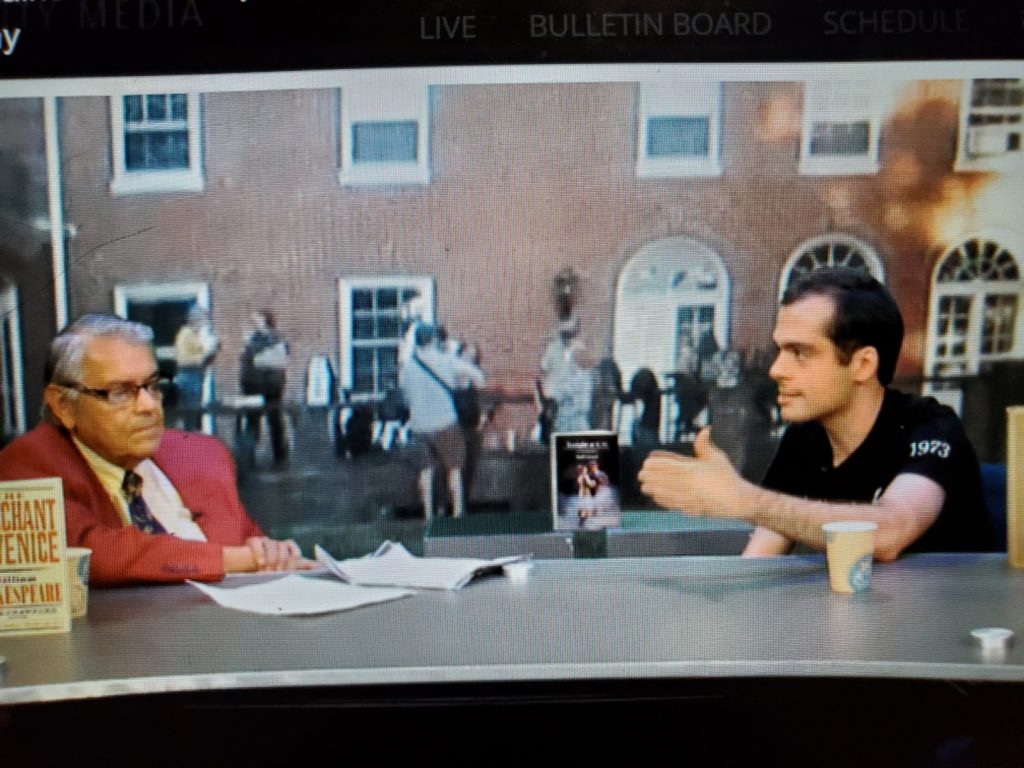
EXCLUSIVE WITH THE EXECUTIVE DIRECTOR OF IRVINGTON SHAKESPEARE COMPANY ON THEIR OPENING NIGHT JULY 15 ON THE GREAT LAWN AT MERCY COLLEGE OVERLOOKING THE HUDSON.
INTERVIEWED BY WHITE PLAINS TV’S JOHN BAILEY.
SHAKESPEARE’S MOST UNIQUE COMEDY PERFORMED ON MIDSUMMER NIGHTS–MEET THE CAST OF MERCY COLLEGE’S RESIDENT THEATRE COMPANY. SHAKESPEARE ON THE GREAT LAWN WITH THE PERFORMANCE ON THE EASY-TO-VIEW TERRACE OF VERRAZZANO HALL
WPCNR COVID REPORT. From Dr. Katelyn Jetelina, of www.yourlocalepidiologist.coim. July 7, 2022:
Driven by Omicron sub-variants, country-level hotspots are now peppered across the globe.
Yesterday, the WHO reported cases are on the rise in 110 countries, causing overall global cases to increase by 30% over the past two weeks. Of course, these numbers and country-level comparisons are only as accurate as testing and reporting.(WHO)In Europe, BA.4/5 is driving a case surge.
Hospitalizations in Portugal finally peaked and are well on their way down. Hospitalizations in other European countries continue to rise, though.
In the U.K., it’s clear that hospitalizations rising are both with and for COVID19. The distribution seems to be stubbornly consistent since a switch during the first Omicron wave last winter, when hospitalizations for COVID19 took the lead.
In India, all eyes are on a new variant: BA.2.75. After first being discovered at the end of May, it quickly took hold and now accounts for 25% of cases, with most samples reported from Maharashtra (Mumbai). There is sparse testing data in India but BA.2.75 appears to be outcompeting BA.5 and BA.2 (with a growth advantage of 17% thus far).
This means it has the potential to cause a wave and is important to follow. BA.2.75 cases have been identified in other countries, like Australia, New Zealand, U.K., and Germany, but remain low at this time.
BA.2.75 carries eight additional mutations on the spike protein compared to BA.2. There are two mutations in particular that are cause for concern: G446S and R493Q. G446S is at one of the most potent sites of escape from antibodies. As the Bloom Lab interestingly pointed out in the figure below, BA.2.75’s impact will be dependent on infection history. Among those with a previous BA.1 infection, the probability of immune escape at spot 446 (and thus infection) is lower than those with a previous BA.2 infection.(Bloom Lab Twitter)A few more thoughts on this sub-variant:Let’s be glad the mutation G446S isn’t on BA.5. If it was, this subvariant could make an even bigger impact. If BA.2.75 does take off, it will be co-circulating with BA.5, so keeping a close eye on recombinants will be important.This makes the fall booster conversation interesting.
Last week, the FDA authorized a BA.4/5 vaccine formula. However, one could make the argument that the original BA.1 vaccine formula would be better with this BA.2.75 news. But, chasing variants is never going to work. Our goal should be broaden protection.
An Omicron vaccine will do that, regardless of the sub-variant circulating.United StatesIn four short months, four Omicron sub-lineages have come and gone in the U.S. Currently, BA.4/5 made a fast entrance and now accounts for more than 70% of tests. Interestingly, BA.4 stopped (or substantially slowed) growth, so this is really now a story about BA.5.
It’s not clear whether BA.5 will result in a wave in the U.S. given our BA.2.12.1 history that other countries did not experience. If we do get a BA.5 wave, it would start about now, so all eyes are on epidemiological trends.(CDC)
The U.S. holds a steady state of ~100,000 reported cases per day. This equates to about 1M “true” cases per day, using back of the napkin math.
(Editor’s Note: The first three days of this week Westchester County was reported by the New York Covid Tracker with 246 new infections Sunday, 259 Monday, and 252 Tuesday an average of 252 a day, heading into the days of the week when new infections increase dramatically. Last week Westchester experienced 1,168 new cases of covid on Wednesday, Thursday and Friday, if that level continues the county will see another week of 2,000 plus infections..)
(At the height of the first Omicron wave, we (USA) experienced ~3.9M true cases per day). The steady state is reflected in national wastewater with plateauing trends across every region.Regional wastewater trends, past 6 weeks Source: Biobot Analytics
Interestingly, our national test positivity rate (TPR) continues to increase and is at a high rate of 17%.
Editor’s Note Westchester’s Postive Rate now is 11-1/2 % positive on testings of just 2,000 persons a day the last 4 days, meaning if you tested more people you would get an untold number of positives out there passing the disease.
Anecdotally, it feels like more and more people are testing positive, too.(CDC)
The disagreeing patterns between cases/wastewater and TPR could mean that a wave is about to come (historically, TPR trends upwards first). Or it’s a reflection that cases are just a terrible measure of community transmission.
Lack of testing, lack of reporting antigen tests, and biased testing (some groups are more likely to get tested than others) are creating really weird trends in metrics.
This begs the question: How do we detect a wave at this point in the pandemic?
Hospitalizations continue to creep up and, on average, 389 Americans are dying each day.
Severe disease will continue to occur.
As the Kaiser Family Foundation reported, in some states, 3 in 4 people are not up to date on their COVID-19 vaccines (this figure does not include the 4th dose).
Also, as we just saw in Portugal, vulnerable groups like the elderly are at risk from high transmission, even if vaccinated.
While incredibly tragic, hospitalizations and deaths do remain below any previous peaks, which is progress.(News nodes) Bottom line
BA.5 is impacting countries across the globe.
Its story in the U.S. is yet to be determined. It’s important to note, though, that we already have a very high, steady level of transmission.
In addition, SARS-CoV-2 continues to mutate so quickly that we start talking about the next variant (BA.2.75) before the current wave peaked.
WPCNR REALTY REALITY.From the Hudson Gateway Association of Realtors. July 7, 2022:
While the perfect storm of low inventory, rising interest rates and persistent inflation have certainly had their impact, the lower Hudson River Valley and greater New York City Suburban real estate markets have continued to show remarkable resiliency in the 2nd quarter of 2022.
And while the market has, in some instances, slowed compared to the over-heated market conditions of 2021, comparisons to the pre-pandemic market of 2019 show very stable conditions. Median sales numbers in the entire area continued to rise in the second quarter, still fueled by low inventory.
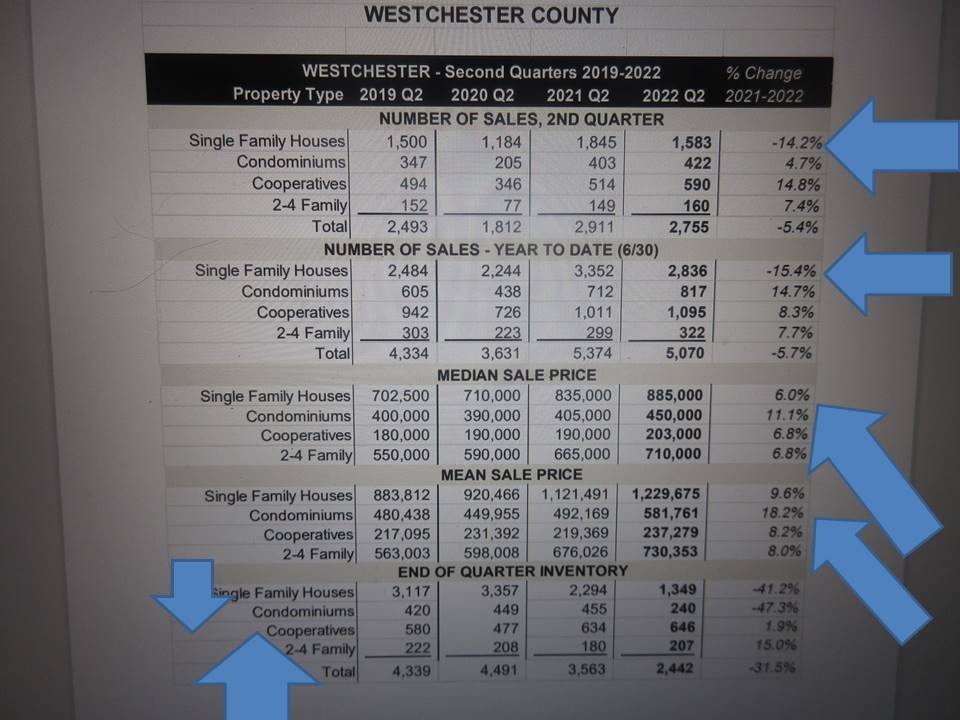
In Westchester County second quarter single-family home sales of 1,583 declined 14.2% compared to the second quarter of 2021. However, when compared to the second quarter of 2019, single-family home sales in Westchester were up 5 percent.
Condo sales in Westchester for the second quarter of 2022 were ahead of 2021 by 4.7 percent and co-op sales were even more robust, coming in 14.8% higher than the 2021 second quarter numbers. The single-family median sale price of $885,000 posted a 6% increase over last year, the condo median sale price of $450,000 was 11.1% higher than 2021, and the co-op median sale price of $203,000 was 6.8% higher than the previous year.
In Putnam County single-family home sales of 243 were down 19.8% compared to the second quarter of 2021, but when compared to 2019, the number of sales were identical. The median sales price of $480,000 was 8.6% higher than the second quarter of 2021.
Rockland County experienced a steeper dip, with single family home sales down 22.8% and condo sales down 31.3%, however, when continuing the comparison to the second quarter of 2019, the 2022 quarter numbers are slightly ahead. The single-family median sales price of $645,000 for the second quarter of 2022 in Rockland County was 17.3% higher than 2021.
In Orange County the 2nd quarter single-family home sales number of 846 was down 12.3% over the 2021 second quarter, and the condo sales number of 119 was off 4.9%. The single-family home median sales price was up 15.3% at $415,000 and the median condo sales price of $275,000 for the second quarter was a 25% increase over the 2021 second quarter.
In Sullivan County the single-family sales number of 273 was off 19% over the previous year but was up more than 25% percent when compared to the 2nd quarter of 2019.
Focusing closer to the city, the Bronx market continued to impress in the 2nd quarter of 2022, with single-family home sales ahead 19.7% over the 2nd quarter of 2021. The median sales price of $617,500 was 9.3% ahead of last year.
There will continue to be challenges in comparing sales numbers to the pandemic year of 2020, when the market came to a grinding halt in the second quarter, and the post pandemic market of 2021, when pent up demand drastically sped up typical buying cycles.
In conclusion, one has to believe that the significant head winds of a declining stock market, rising inflation, rising interest rates, and the threat of a recession will continue to take their toll on the housing market.
However, continued strong buyer demand, low inventory, and a strong labor market appear to be mitigating factors. Also, there have not been any significant price corrections given the current economic headwinds.
Depending upon the length and depth of a recession (if there is one), the lower Hudson River Valley and greater New York City Suburban real estate markets should continue to demonstrate stability going forward into 2022. So far, the housing market appears to be rising above the perfect storm.
WPCNR DAYLIGHT RAMBLER. Aesthetics & Comment by John F. Bailey. July 5, 2022:
I went back to the Museum of Modern Art in gloriously alive New York City, USA yesterday with Brenda Starr my cultural attache’ to see the Henri Matisse exhibition.
It was a glorious day in the Greatest City in the World as WABC’S Ron Lundy used to call it (when WABC 77 was MusicRadio and made you happy).
Parking on 51st Street we walked crosstown in the “lived in” chaos- glory rolling in front of us and soaring around us of New York City where the vain the profane and the gets-into-you humanity in all its one-and-many-and-all kinds amazes the senses. New York makes you alive and makes your heart beat.
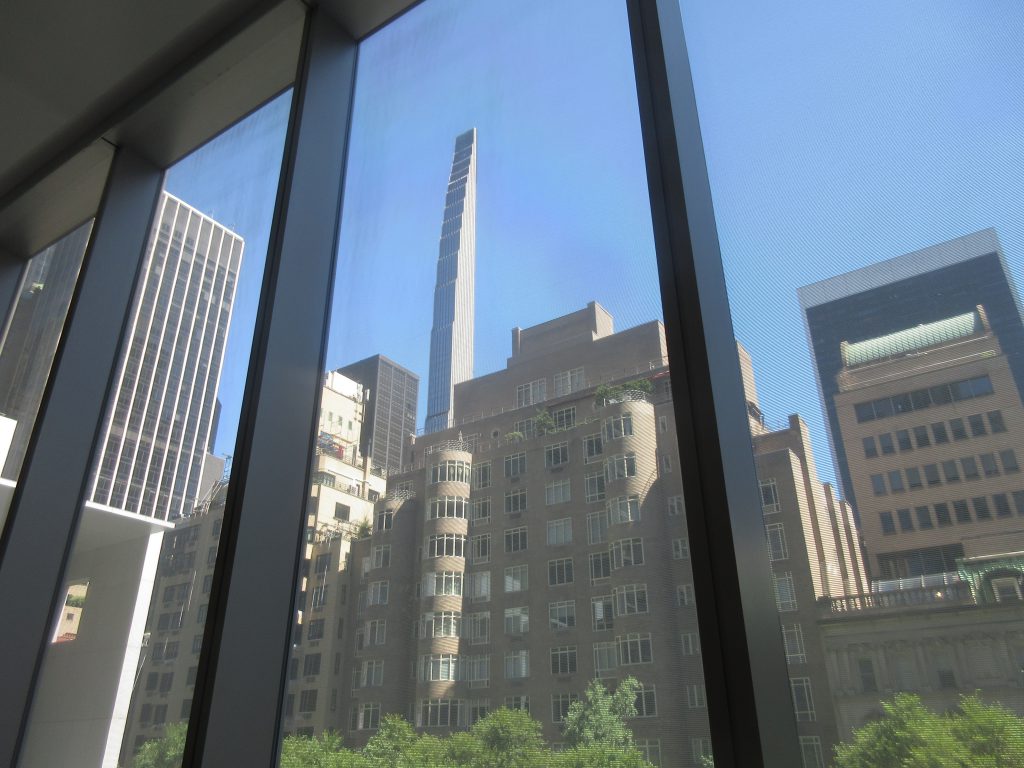
Entering MOMA now overlooked by a “supertall” ascending into the sky overlooking a art deco residence with circular terraces which is amazing to see, we entered the echoing big white entrance and ascended to the third floor where the Matisse exhibition is. It is there until September.
Henri Matisse is the Post-Impressionist pioneer of 1911 in which from his Red Studio in Montparnesse he created in-your-face jagged color shapes projecting jarring assaulting the observer with images that jump out at you, new art for his time, yet still as new as it was when he painted them.
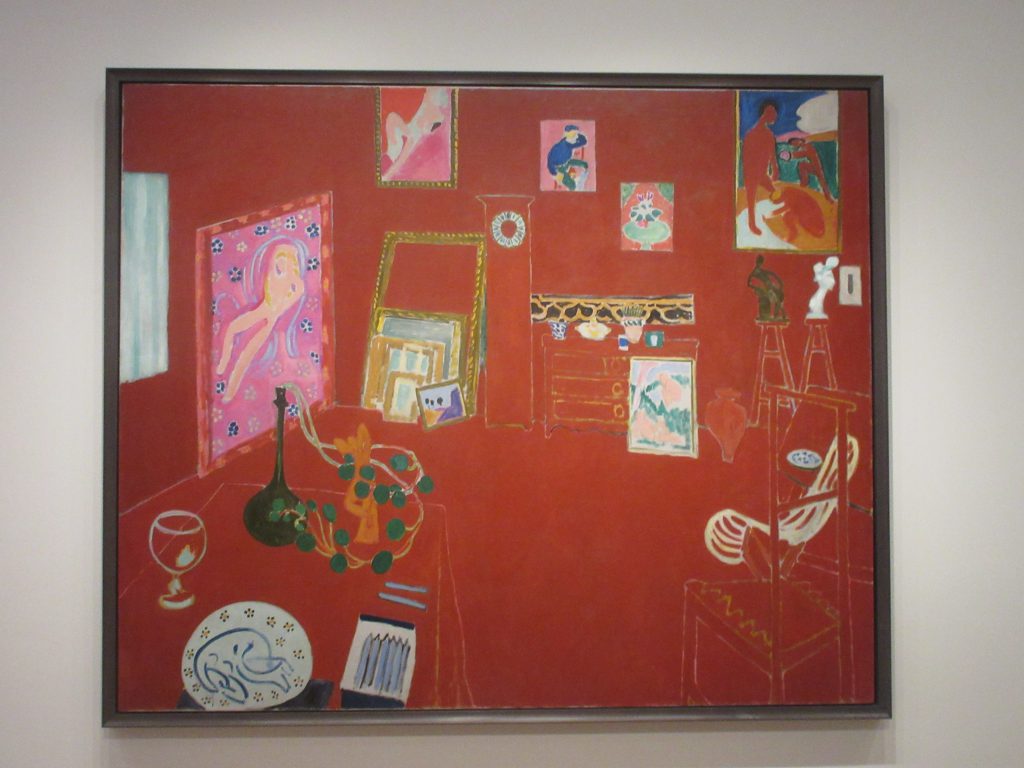
The original paintings you see here in the painting below took art from the realism and dreamlike beauty of the Impressionists to visuals that that assault and draw you in to the humanity of the individual, the vibrance of the real persons he painted in “The Red Studio.”
“The Red Studio”L’Ateliar Rouge, painted 1911
His most famous painting is on display in an interactive gallery. Mr. Matisse felt it was his best work, but his Russian patron, Sergei Shchukin, whom he presented it to, did not like it. You can read the correspondence with the patron in the MOMA exhibit. Reading between the lines, Matisse who felt it was his best work, eventually sold the painting to the Gargoyale Club in London, where it hung in the bar.
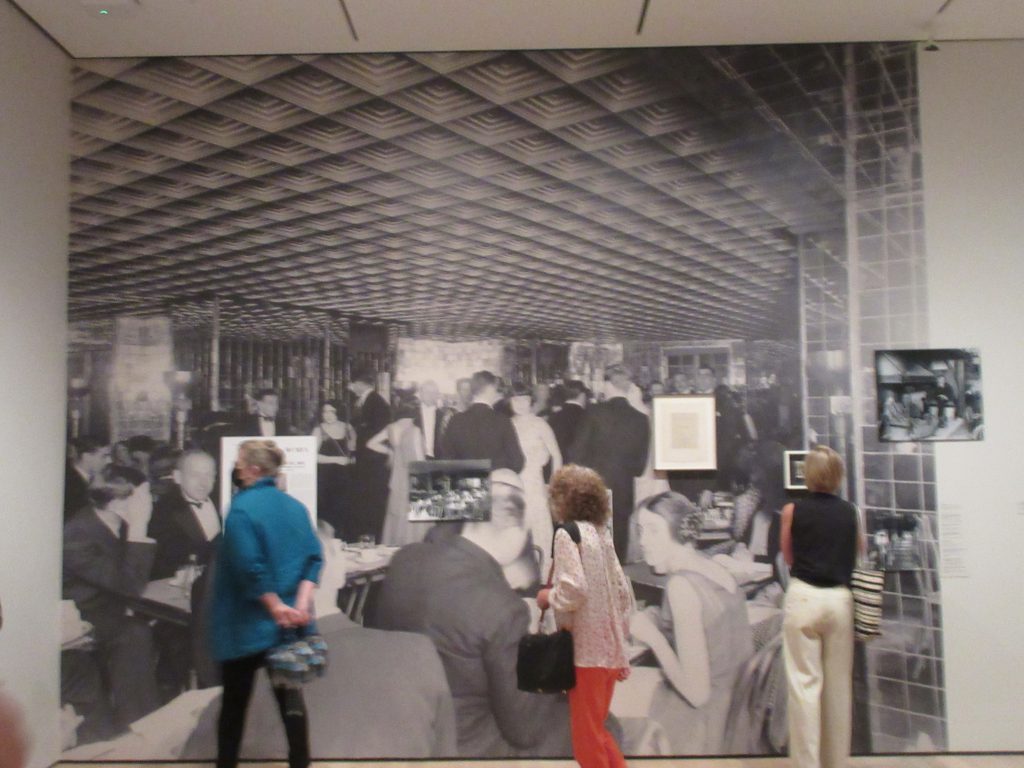
Brenda Starr mingling at the Gargoyle Club London (photograph from the 1920S on display at MOMA
The Gargoyle Club was the “City Limits” of London, the “21 Club” of the upper class London crowd at the time. Eventually the owner of the Gargoyle Club wanted to sell the painting back to Mr. Matisse, but the painting, a heartbreak for Matisse, he did not want back. The work when displayed in New York with other of his paintings became the sensation of the art world in New York. Even then, if could make it in New York you could make it anywhere.
When I saw “The Red Studio” painting yesterday it drew me into itself and radiated the creative life, the atmosphere which so inspired Mr. Matisse.
Every work of art does that to you if you let it , and “The Red Studio” lights up this tastefully displayed exhibition of Mr. Matisse’s works in a distanced way from the “Red Studio” where Mr. Matisse created them so they like so many different children of the artist’s brush strokes stood apart on their own.
I do not know if this was the studio’s intent, but the curator/designers of this exhibit have not crowded the works but set them apart but together reminiscent of a “cocktail party of paintings” holding court and working the effervescent essence of these forerunners of realism.
“The Red Studio” will work on you the viewer with a magic “reach out” visual, emotion rush of what a creative space does for the artist. The painting includes pictures in it of works Matisse painted in the studio of red walls. It is an amazing creative concept.
What MOMA has done is they have analyzed the painting and discovered an amazing thing about how the painting was created. Through the magic of electronic devices that can “see” into a painting MOMA’s curators and analysts and painting reseachers explain in a video how “The Red Studio” was created.
Analysis done when the painting was reframed showed it originally had not been red. It had been green, yellow and sundry shades, essentially a painting of the room Matisse worked. The video showing the analysts telling what their analytical technology revealed to them was that Matisse considered his finished work, then in a sense the painting inspired him to make a drastic change.
The analysts said Matisse painted around the original paintings and objects in the painting with red.
They said the brush strokes applying the red were firm, broad, splashed and what can be described as quick saturating strokes.
What I drew from this is the power of the creativity within Mr. Matisse took over, gave him the idea to add the power “red” to the painting which actually was the color of his real studio.
That revelation revealed by not an autopsy but an examination of the “living painting” that delivered the spirit of the artist, the audacity, adding a major change to the painting not knowing whether or not it would be great or would ruin his work.
That filled me with wonder.
“The Red Studio” exhibition of this audacity of the artist, (and every artist has this), delivered to me the value of art we sometimes forget.
The last painting Matisse ever did was another portrait of his studio. This is it below. I felt this showed how much Mr. Matisse realized what the original “Red Studio” meant to him.
His last painting.
Art is there to remind us of the unlimited capacity for creativity, and higher judgment we possess whether we paint, write build.
“The Red Studio” became famous in New York.
New York critics were just awed by it.
And modern art was born about a century ago.
I love old pictures of ruins of the past. I mourn the destruction civilizations of the past wrecked on cities of the past they had conquered, only to be discovered by future generations.
We learn from the past.
We learn from the artists of the past, people like us who tried and those who dared like Henri Matisse, as doubtful as any of us, came up with at once a painting that embodies the essence of creativity of listening to what your talent tells you to do and having confidence in it.
We learn from the past.
F. Scott Fiztgerald’s character, Nick Carraway was right at the end of The Great Gatsby, when he wrote, “So we beat on, boats against the current, borne back ceaselessly into the past.”
Henri Matisse will be at MOMA through the summer.
He is a must see.
His story, his art, so embodies the spirit of hope and faith in ourselves that sustains us.
(Editor’s Note: the applications referred to in the following letter are not on the published agenda for Tuesday evening’s Common Council at the present time as published on the city website. From time to time items are sometimes added at the start of the evening meeting.)
Forgive me for imposing on your holiday weekend, but with an extremely critical Common Council meeting tomorrow, Tuesday (July 5), this message cannot be delayed.
As most of you know, several new applications for wireless cell antennas have come into the City of White Plains. The radiation exposures from these antennas, which are essentially mini-cell towers, are destined to cause significant health effects in the surrounding communities. This is not hearsay or scaremongering. It is fact… backed up by at least 11,000 non-industry funded, peer-reviewed scientific studies documented at the NIH’s National Library of Science.
There are 16 proposed new antenna sites. Originally 25 were posted (9 in error) by the Dept of Public Works.
16 is 16 too many! Here are the locations which are on 60-day “shot clocks,” i.e., if we don’t stop the clock immediately, the application will automatically be approved:
89 West Post Road
8 Dekalb Avenue
110-118 South Lexington Avenue
14 Cromwell Place
Unidentified # Bloomingdale Road
150 West Post Road
70 Westchester Avenue
5 Rathbun Avenue
173-183 Westchester Avenue
350 Main Street
265-279 Hamilton Avenue
114 Bloomingdale Road
198 Central Avenue
59 Court Street
15-29 Hamilton Avenue
646 Mamaroneck Avenue
These sites are primarily in industrial/commercial areas (nearby many rental buildings, incidentally). But make no mistake… this is just a prelude to the next influx which will undoubtedly spread the towers farther into residential areas.
WHY IS THIS HAPPENING? WHAT ARE WE DOING ABOUT IT? AND WHAT WILL WE DO TO LIMIT FUTURE ANTENNA SITES?
Why this is happening:
Sadly, the 2.3 trillion dollar telecom industry is using its wealth and power to pay the salaries of 500 Congressional lobbyists and buy out the FCC, the agency tasked with protecting the public (see attached “HARVARD_FCC” pdf).
5GAlert Westchester is one of more than 150 grassroots groups nationally fighting for safe technology. Until we are victorious, which we will be, the only way to limit 5G close-proximity antennas is through the passage of a protective municipal Telecom Ordinance. That means it’s in the hands of our City government!
What we are doing now to hold back the 16 new installations:
We are urging the White Plains Commissioner of Public Works to “stop the clock.” This can be done and must be done when applications are deemed to be incomplete or deficient. To understand the breadth of this effort, see attached letter to Commissioner Mignone. After reading the letter, call or email your demand that the clock be stopped on Verizon cell antenna applications. Contact information below.
What we’re doing to keep future antennas away from homes:
After two years of pressing and urging, we now have a majority of the Common Council willing and ready to add vital protections to the current weak White Plains Telecom Ordinance.
Only problem: it’s not at all clear that the Mayor and his lead attorney, John Callahan, will draft the legislation for our elected officials to vote on. So keep your calls and emails flying. Tell them you refuse to be radiated in your own home!
Just as ordinary citizen Candy Lightner was compelled to found the organization MADD after her daughter was killed by a drunk driver – I, too, have been compelled by a life-changing wireless injury to warn you… THIS IS REAL… we must do whatever we can to stop the insanity of allowing the installation of cell towers in our front yards. Btw,5G will not improve your cell signal.
We have 1,000+ Petitioners. The more we have, the louder our voices. Please immediately call 5 White Plains friends and ask them if you can add their name to the PETITION. (Use the link).