Hits: 0
APPEARS TUESDAYS ON WVOX 1460
“GOOD MORNING WESTCHESTER WITH
DENNIS AND TONNY.
“WESTCHESTER IS ALL SET FOR SCHOOL OPENING DENNIS AND TONNY, BECAUSE WE ARE AT EXACTLY THE SAME COVID LEVELS THE COUNTY FOUND ITSELF IN ONE YEAR AGO BEFORE A PERHAPS OVERCONFIDENT PUBLIC BY THEIR BEHAVIORS AND LACK OF RESTRICTIONS SENT INFECTIONS SOARING IN JANUARY TO 36,000 INFECTIONS.
GOING INTO THIS YEAR THE COUNTY HAS A DO-OVER TO DO SCHOOL AND SOCIALIZING OF THE FALL BETTER THAN THEY DID LAST YEAR
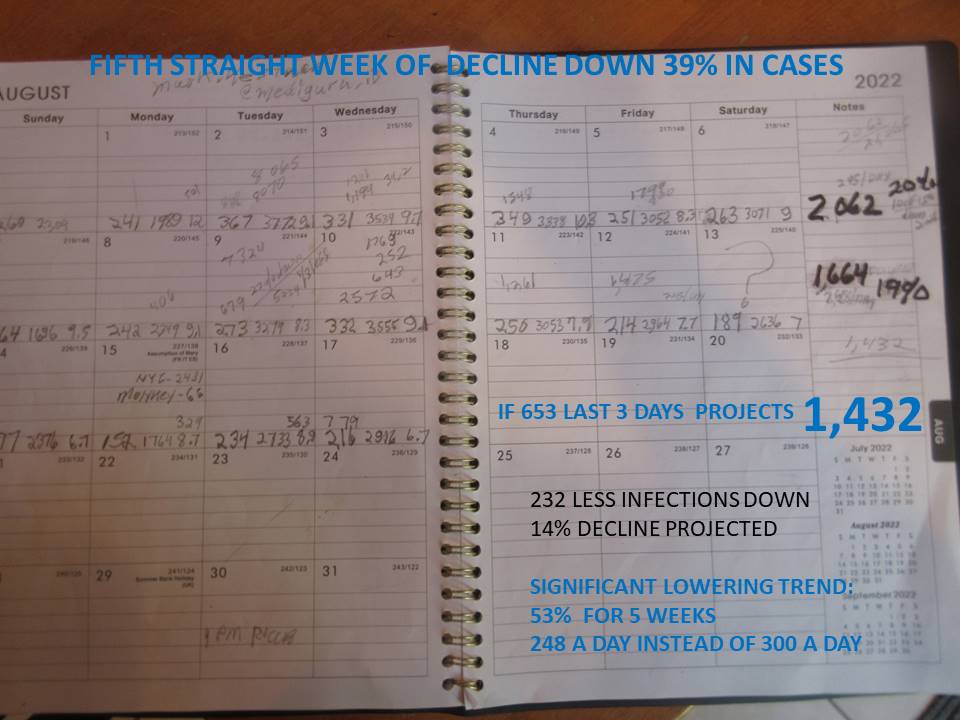
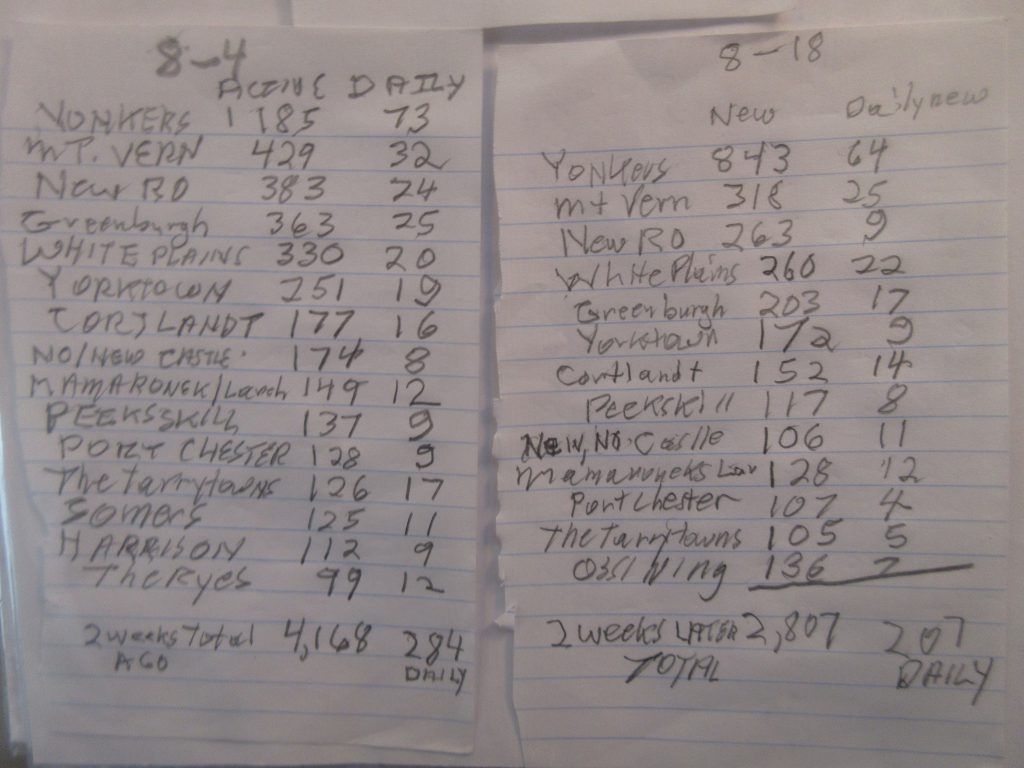
THE REASON IS THE COUNTY HAS TURNED ITS JULY NUMBERS AROUND TURNING IN ITS 6TH WEEK IN ROW OF SIGNIFCANT REDUCTIONS IN COVID CASES.
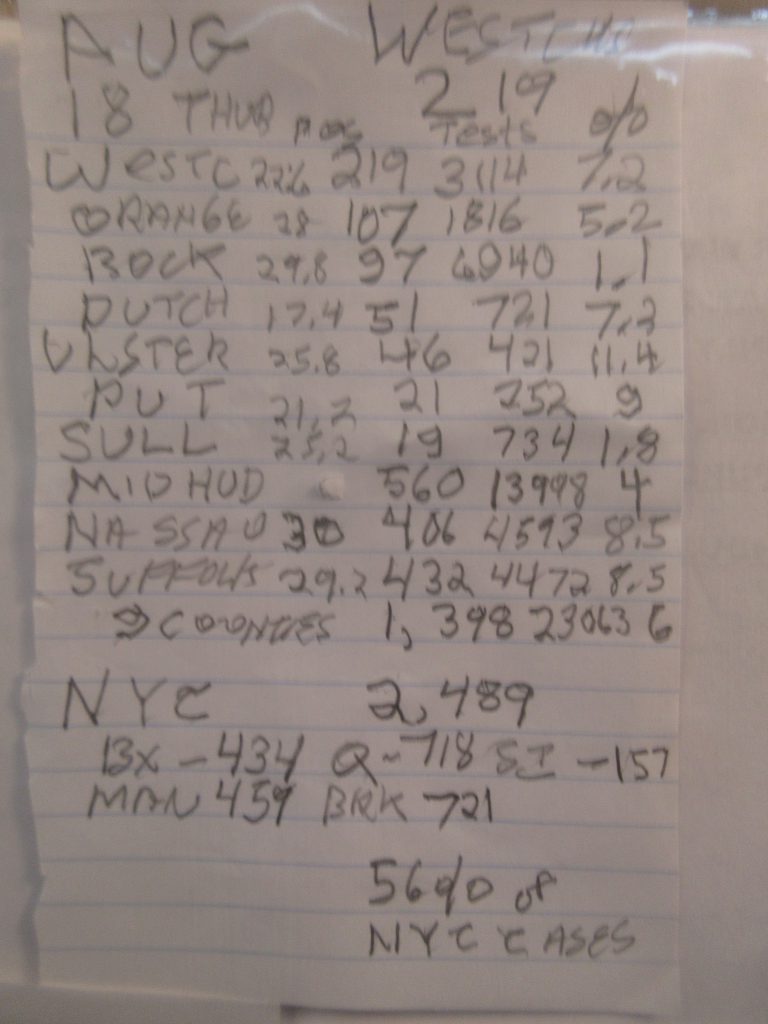
WESTCHESTER CUT ITS RATE OF NEW INFECTIONS THE FIRST 3 WEEKS OF AUGUST 49%
WESTCHESTER REPORTED 162 PERSONS POSITIVE SATURDAY BRINGING AUGUST 14 TO 20 NEW INFECTIONS DOWN 22% FROM 1,664 A WEEK AGO DOWN TO 1,299:
1,229 IS THE LOWEST NUMBER OF INFECTIONS IN A WEEK IN 5 MONTHS
YOU HAVE TO GO BACK TO MARCH 27 TO APRIL 2ND WHEN THE COUNTY REPORTED 1,095 INFECTIONS FOR A LOWER NUMBER OF INFECTIONS.
LAST YEAR AT THIS VERY DATE THE 3RD WEEK IN AUGUST. AUGUST 23, 2021 BRENDA STARR’S BIRTHDAY, WESTCHESTER HAD 5,704 NEW CASES.
TODAY AUGUST 23, 1 YEAR LATER OUR COUNTY HAS RECORDED 5,025 CASES, 673 PERSONS — 12% LESS THAN LAST YEAR AT THIS TIME. THIS IS GOOD.
In July of 2021 Westchester showed 1,724 new positives generating 5,704 cases last August.
AT THE END OF JULY THREE WEEKS AGOTHE COUNTY HAD 10,298 COVID POSITIVES—AND THE THE 10, 298 SO FAR HAVE SPREAD COVID TO JUST 5,025.
THIS MEANS DENNIS — ONE OF TWO THINGS EITHER PEOPLE ARE NOT GETTING PRC LAB TESTS AFTER THEY AGGREATE TEST POSITIVE, MEANING OUR POSITIVES ARE BEING UNDER REPORTED OR HERD IMMUNITY HAS SUNK IN.
LET’S GIVE THE CITIZENS CREDIT FOR BEING SMART, TOUGH, CAREFUL AND CONSIDERATE OF THEIR FAMILIES, STRANGERS AND THE PUBLIC. YOU SHOULD CONTINUE TO DO SO.
A REPEAT OF LAST FALL WHEN THE DISEASE GATHERED MOMENTUM EVEN WHEN TESTING WAS MANDATORY AND POSITIVE INFECTED PERSONS QUARANTINED, COVID TRACING WAS IN EFFECT, AND QUARANTINES TOO, THE DISEASE BLASTED OFF IN DECEMBER AFTER GROWING STEADY IN SEPTEMBER, OCTOBER AND NOVEMBER.
SCHOOL DISTRICTS SHOULD THINK SERIOUSLY ABOUT THIS.
WE WILL FIND OUT HOW WHITE PLAINS WILL OPEN ITS SCHOOLS OFFICIALLY IN ABOUT A WEEK
BUT THERE IS ONE HUGE FACTOR IN THE COUNTY DIRECTLY AFFECTING THE SCHOOL REOPENINGS.
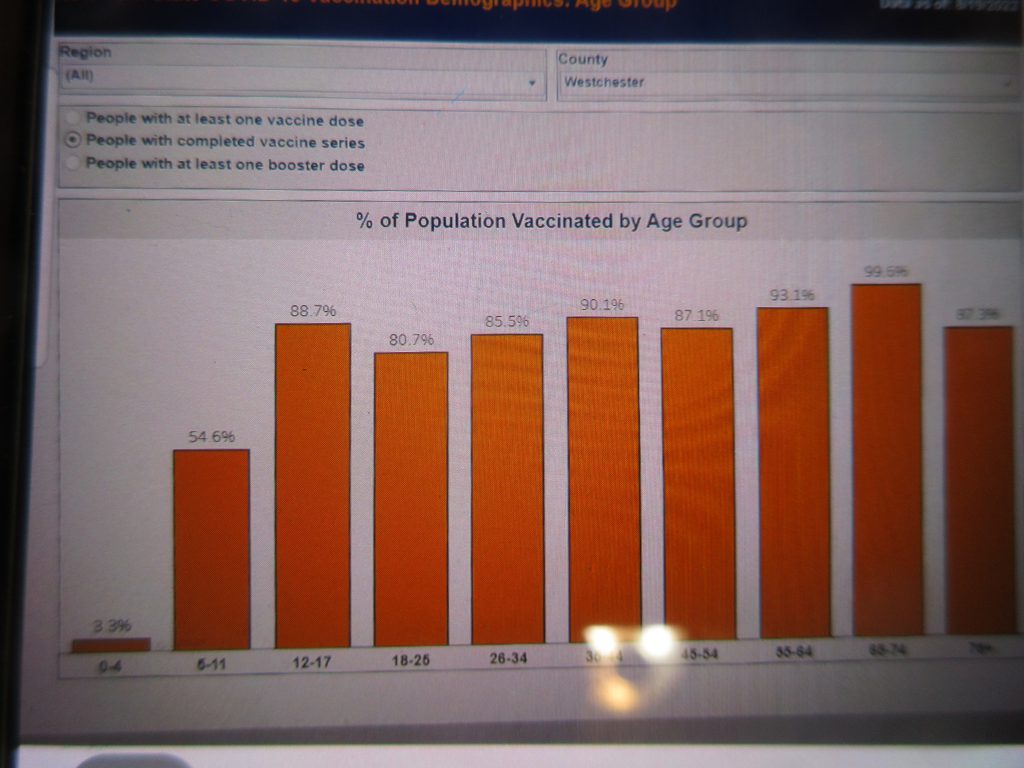
PARENTS ARE NOT VACCINATING THEIR UNDER-5 CHILDREN, EVEN THOUGH THE VACCINE FOR UNDER 5’S HAS BEEN AVAILABLE FOR TWO MONTHS, CURRENTLY. THIS IS A COVID SURGE WAITING TO HAPPEN.
THE NEW YORK STATE DEPARTMENT OF HEALTH VACCINATION TRACKER YESTERDAY REPORTS
97% OF UNDER 5’S ARE NOT VACCINATED
45% OF THE ELEMENTARY SCHOOL CHILDREN IN THE COUNTY ARE NOT FULLY VACCINATED
10% OF MIDDLE AND HIGH SCHOOL STUDENTS ARE NOT FULLY VACCINATED
20% OF COLLEGE STUDENTS 18 TO 25S ARE NOT FULLY VACCINATED.
AT THIS MOMENT TWO WEEKS BEFORE SCHOOLS STARTS– THOUSANDS OF CHILDREN AND YOUNG PEOPLE SUBJECT TO INFECTION BECAUSE THEY HAVE NOT BEEN FULLY VACCINATED.
LAST YEAR WITH REMOTE LEARNING IN EFFECT THAT WAS LIFTED IN THE SPRING, WHITE PLAINS HAD 25% OF ITS 7,979 STUDENTS, STAFF, TEACHERS AND ADMINISTRATIVES TEST POSITIVE, 1,994 PEOPLE.
THAT HAPPENED WITH SOCIAL DISTANCING, MASKING, PLASTIC SHIELDS BETWEEN DESKS. AND RANDOM TESTS AS CHILDREN ENTERED SCHOOL.
IT APPEARS MANY DISTRICTS ARE GOING BACK TO ELIMINATING THOSE SHIELDS, SOCIAL DISTANCING AND DUMPING MASKS
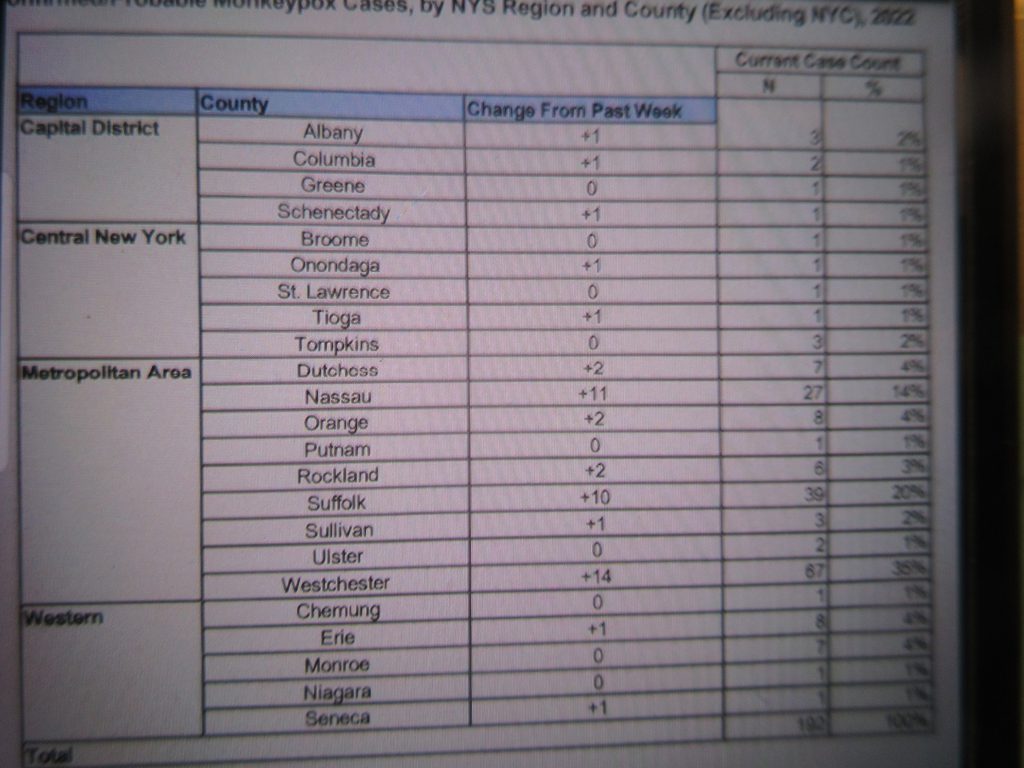
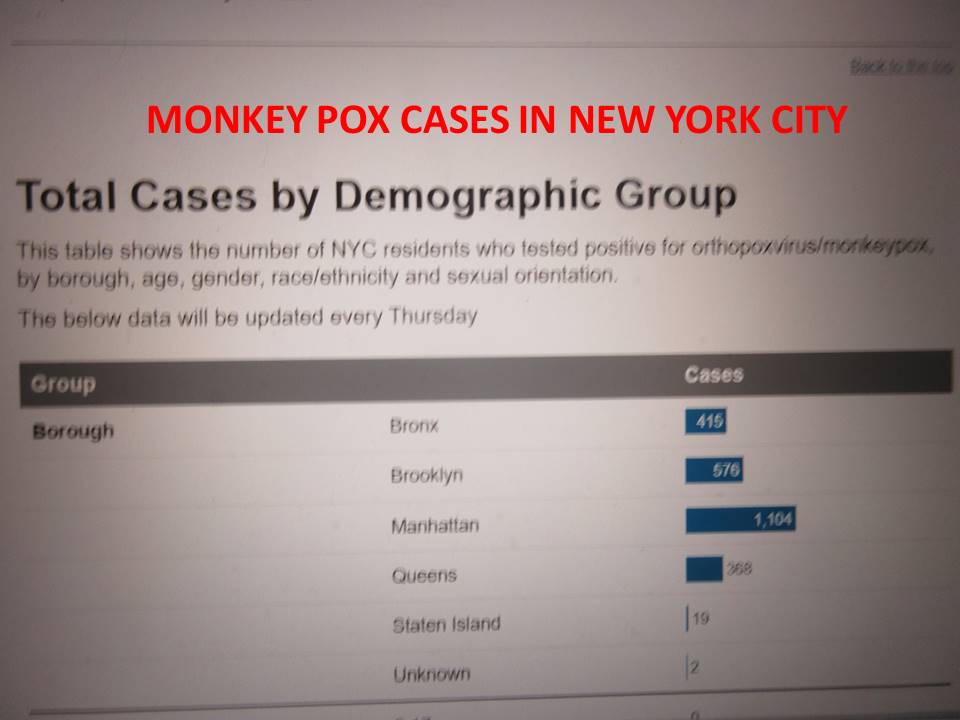
MONKEYPOX HAS 75 CASES REPORTED IN WESTCHESTER AS OPPOSED TO NEW YORK CITY THAT HAS MORE MONKEYPOX CASES THAN NEW COVID CASES.
IN WHITE PLAINS, THERE’S A NEW CONTROVERSY IN WOODCREST HEIGHTS. IT WAS LIKE OLD TIMES AT THE PLANNING BOARD WITH WOODCREST HEIGHTS RESIDENTS PROTESTING THE PLANS OF THE OWNERS OF A SLOPED PROPERTY UP IN THE HEIGHTS WHO WISH TO BUILD A HOUSE INTO THE SIDE OF A HILL. ANOTHER EXAMPLE OF PEOPLE NOT ALLOWING AN OWNER TO BUILD SOMETHING ON PROPERTY THEY OWN.
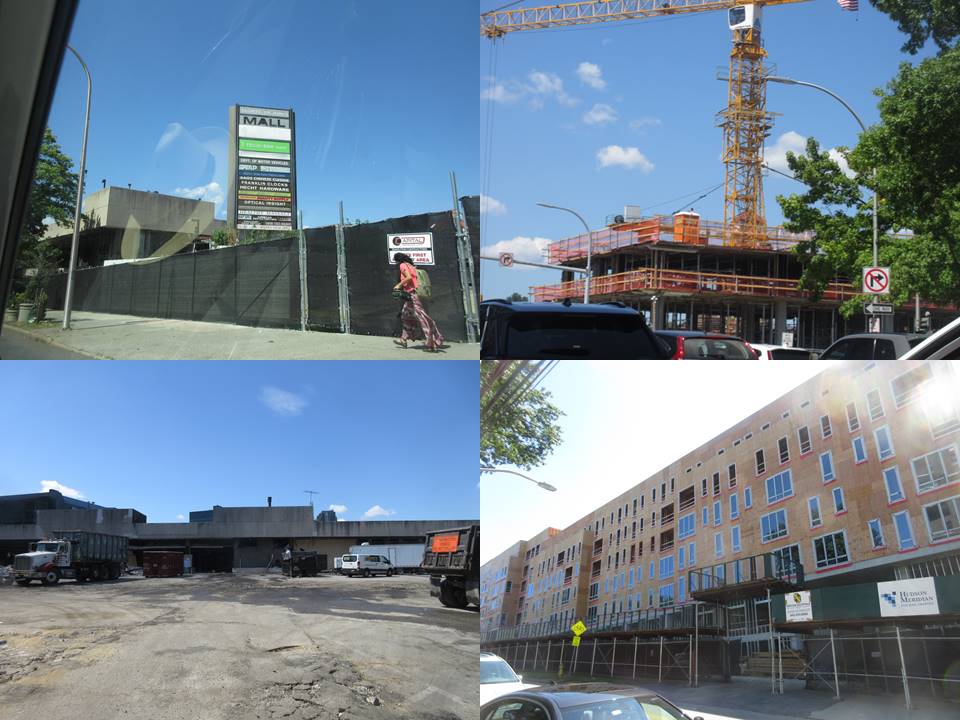
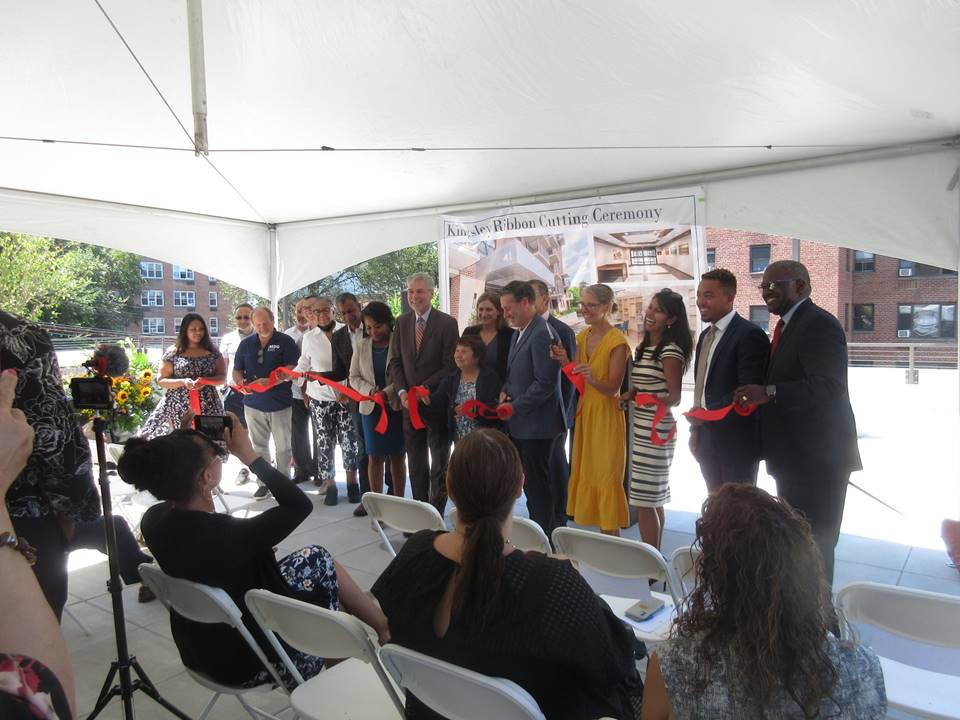
ALSO DOWN TOWN ON BARKER AVENUE, THE KINGSLEY TWO—A BUILDING BUILT IN 1968 AS PART OF THE MITCHELL LAMA PLAN PASSED IN 1965..WAS REMODELED INTERIORLY BY THE STATE OF NEW YORK.
AT THE RIBBON CUTTING MAYOR TOM ROACH REAFFIRMED HIS COMMITMENT TO AFFORDABLE HOUSING, SAYING HE WANTS EVERYBODY TO BE ABLE TO AFFORD TO LIVE IN WHITE PLAINS. THE COMMISSIONER OF NEW YORK STATE HOMES AND COMMUNITY RENEWAL, RUTHANNE VIS NOW SKAS SAID IN 5 YEARS THE STATE HAS RENOVATED AND MODERNIZED 25,000 MITCHELL-LAMA BUILINGS ACROSS THE STATE.
I HOPE EVERYBODY IS GOING TO COME ON UP OR COME ON DOWN TO WHITE PLAINS NEW YORK USA FOR THE JAZZ FESTIVAL STARTING SEPTEMBER IN SEPTEMBER. GO TO WPBID.COM FOR PERFORMANCE TIMES AND THE ARTISTS APPEARING.
WE HAVE A NEW EVENT: PURDY HOUSE WILL HOST `STEVEN PAUL DEVILLO AUTHOR OF “THE BATTLE OF WHITE PLAINS: WASINGTON AND HOWE IN WESTCHESTER ON SUNDAY SEPTEMBER 18 AT THE HISTORIC JACOB PURDY HOUSE…AND IT IS FREE BUT YOU NEED TO RESERVE EARLY.
IT’S BEEN A PLEASURE, DENNIS AND TONNY.