The State Education Department today released the results of the 2016 Grades 3-8 English language arts (ELA) and math tests.
In ELA this year, the percentage of students in grades 3-8 who scored at the proficient level (Levels 3 and 4) increased by 6.6 percentage points to 37.9, up from 31.3 in 2015. In math, the percentage of students who scored at the proficient level increased this year to 39.1, up one percentage point from 38.1 in 2015.
(Editor’s Note: In the White Plains City School District, 38% of Grades 3 to 8 students passed the English Language Arts Assessment, the state average, while 35% of White Plains 3-to-8-ers passed the Math Assessment, compared to an average of 39% passing Math Assessment across the state. Though the state says you cannot compare the 2016 test results to 2015 test results; the White Plains ELA passing rate was up about 40% (38% to 30%)
|
% of Students Proficient in Grades 3-8
|
|
2015
|
2016
|
Percentage Point Change
|
|
Statewide Combined Grades ELA
|
31.3
|
37.9
|
6.6
|
|
Statewide Combined Grades Math
|
38.1
|
39.1
|
1
|

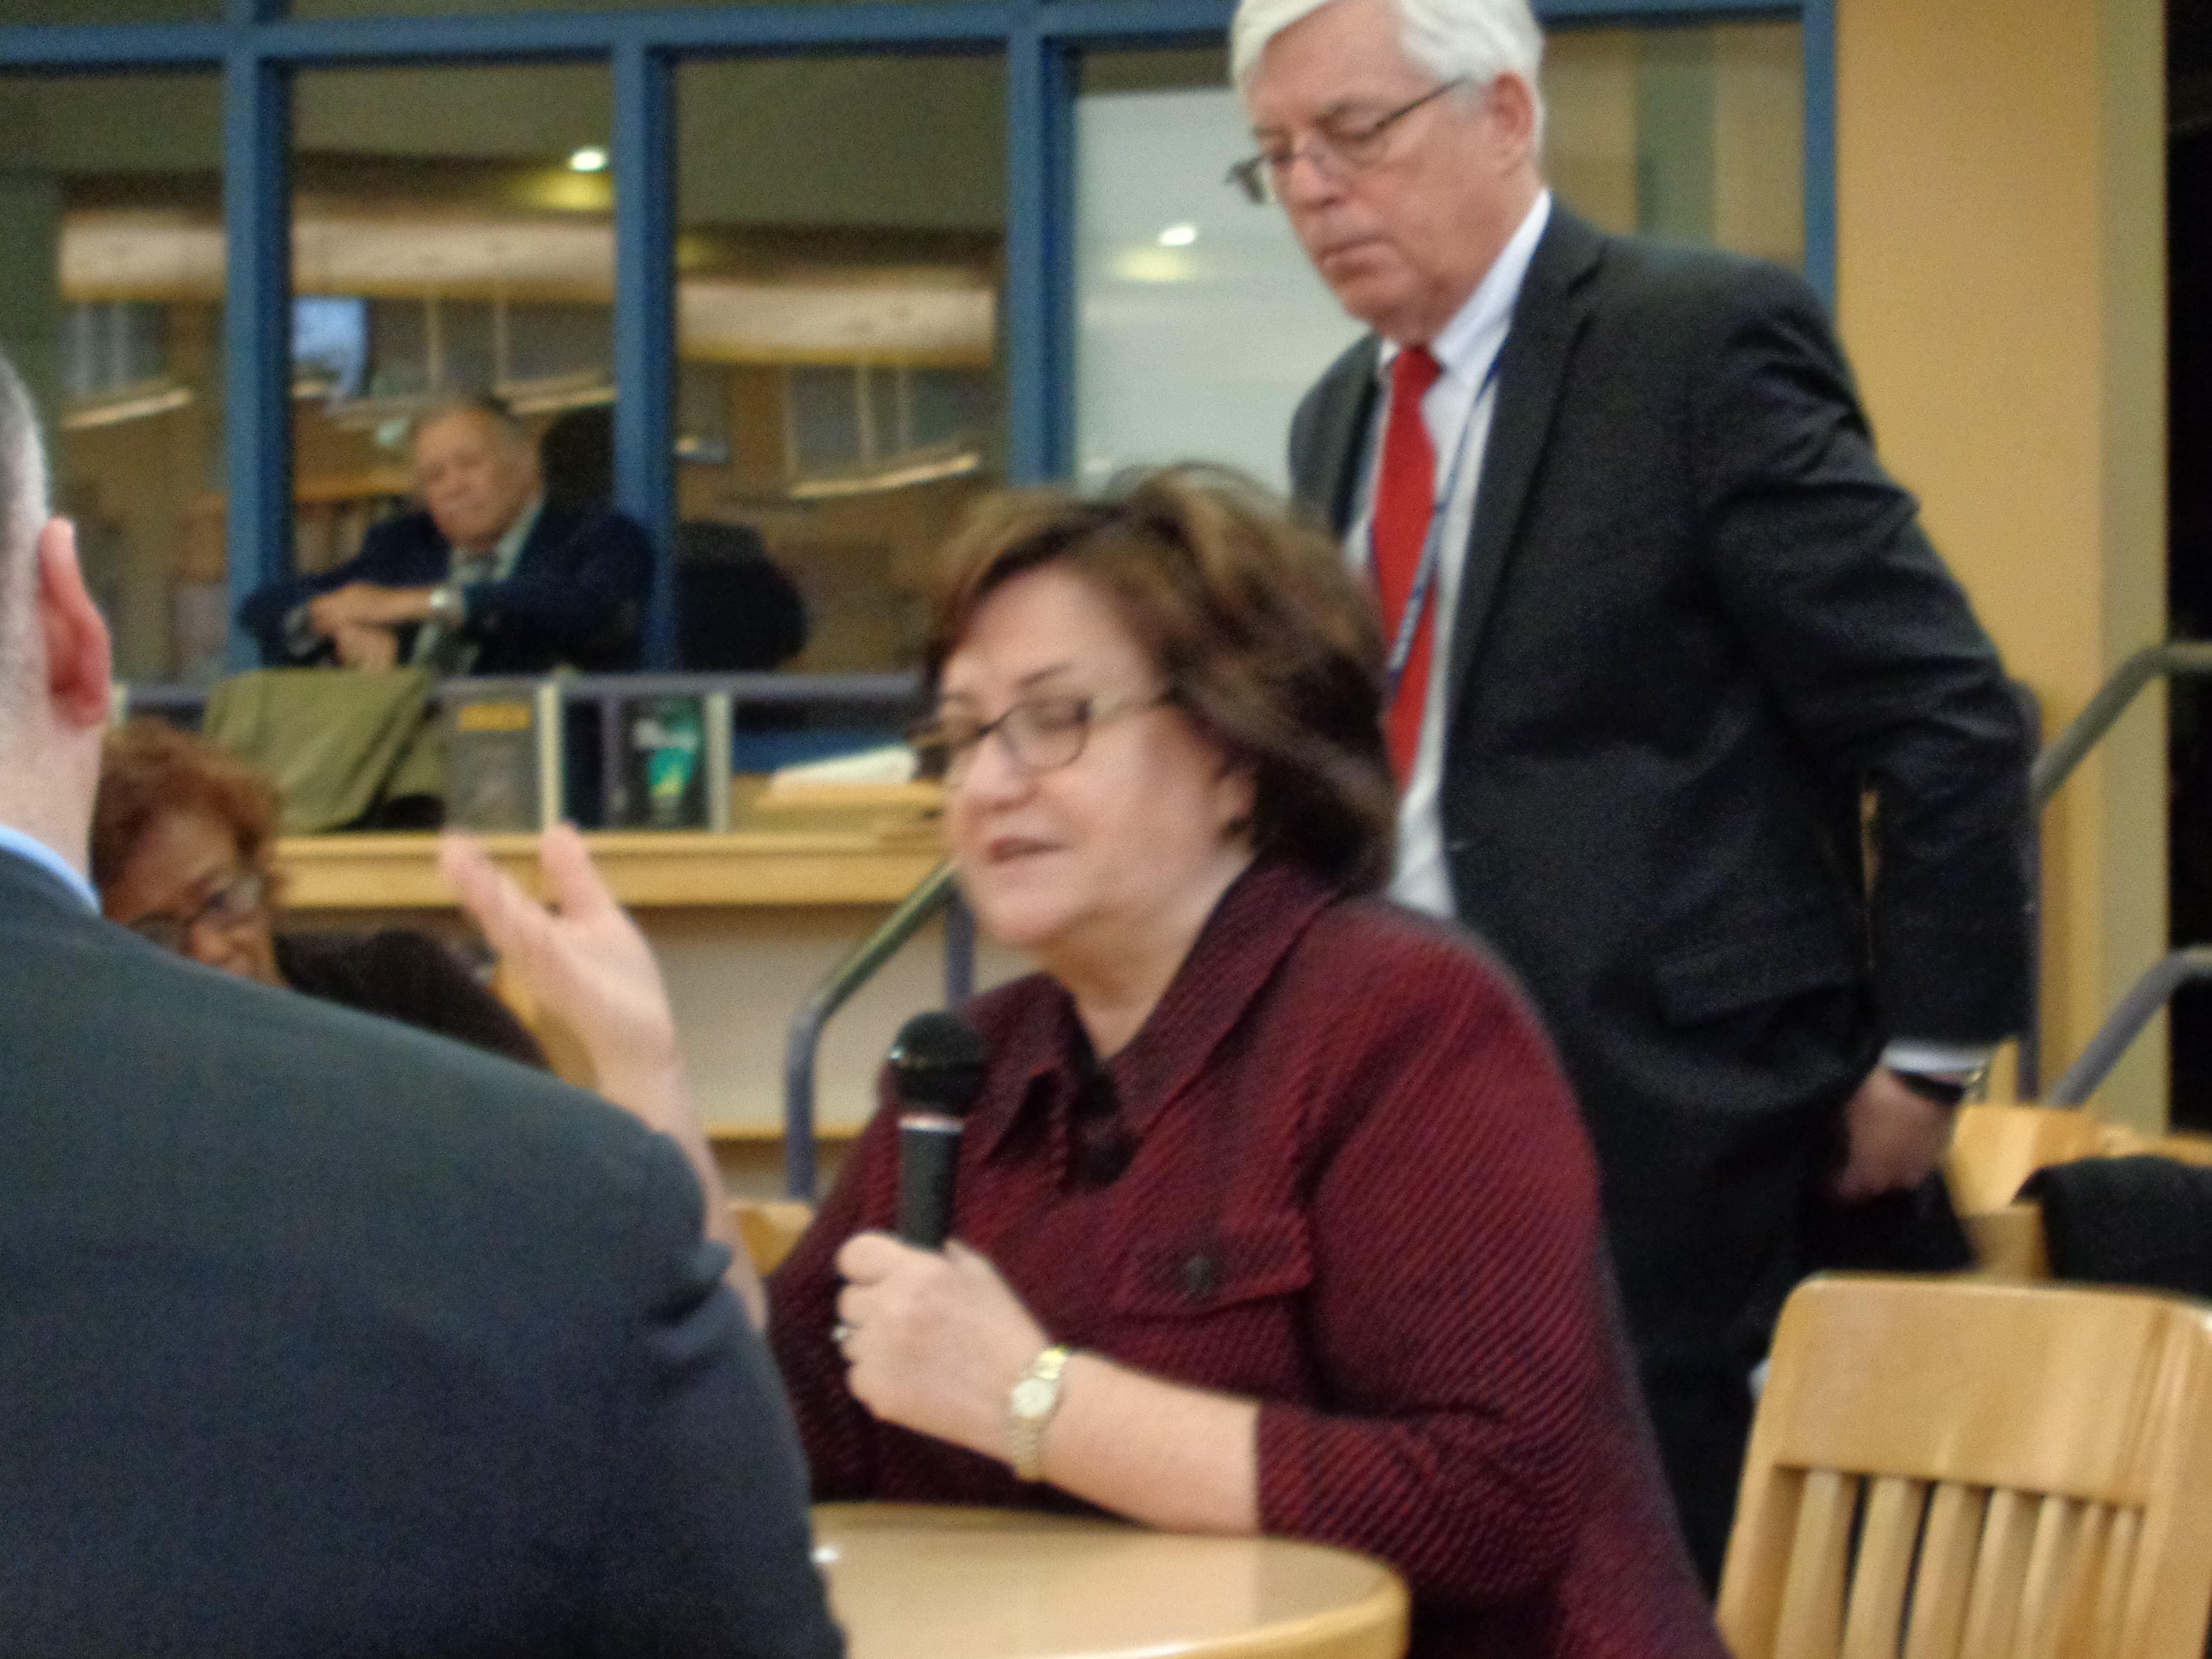
Commissioner of Education Maryellen Elia appearing in White Plains High School this spring.
“The Regents and I are committed to continuously improving our standards, our curriculum and our assessments,” State Education Commissioner MaryEllen Elia said. “Since my first day on the job a little over a year ago, I’ve been listening to parents, teachers, school administrators and the public – seeking their expertise on how we can improve. We’ve taken their advice and made important changes to the exams. It’s an ongoing process, but better standards, better curriculum and better tests will result in better student outcomes.”
“The Regents, Commissioner and I have worked hard to make New York’s assessments the best they can be for our students,” Board of Regents Chancellor Betty A. Rosa said. “I’ve always said that tests must be diagnostic, valid and reliable while providing timely and practical information to parents and teachers. We made important changes to the assessments this year and we’re going to continue to look at ways to make them even better moving forward. While it’s not possible to make direct comparisons of this year’s results to past years, I’m cautiously optimistic the changes we’re making will drive improvements in teaching and learning.”
2016 Results
SED made several changes to the 2016 ELA and math exams through a deliberate process. These changes included: starting with a new test vendor with a contract that required greater teacher involvement; reducing the number of questions on every grade 3-8 ELA and math assessments; and allowing students who are productively working to complete their exams.
In addition, SED released more test questions than ever before and earlier than ever before to support instruction. Further, when parents receive their child’s school reports later this summer, they will see that they are easier to understand and provide more information on how their child performed.
This year’s changes to the tests are part of a multi-year process that started with the Board of Regents’ Test Improvement Report in June 2015 and then solicited feedback from parents, teachers, administrators and students. The process included making recommendations(link is external) as part of Governor’s Task Force and presenting the final changes to the Board of Regents in December 2015. SED implemented the changes in time for the spring 2016 exams.
While the content of the 2016 tests and last year’s tests are comparable and similarly rigorous, it is not possible to make direct comparisons of the 2016 results to prior years’ results because of changes to the tests this year. The 2016 results are valid and reliable indicators of student proficiency in the tested grades and subjects.
Big 5 City School Districts
In ELA this year, the percentage of all test takers in grades 3-8 who scored at the proficient level increased over last year in each of the Big 5 City School Districts. New York City’s proficiency increased by 7.6 percentage points to 38 percent. For the first time, New York City now meets the rest of the state in proficiency in English Language Arts
In the other Big 5 cities, student proficiency increased over last year as follows: Buffalo increased by 4.5 percentage points; Rochester increased by 2 percentage points; Syracuse increased by 2.8 percentage points; and Yonkers increased by 5.7 percentage points.
|
% of Students Proficient in ELA Across All Grades, 3-8
|
|
2015
|
2016
|
Percentage Point Change
|
|
NYC
|
30.4
|
38
|
7.6
|
|
Buffalo
|
11.9
|
16.4
|
4.5
|
|
Rochester
|
4.7
|
6.7
|
2
|
|
Syracuse
|
8.1
|
10.9
|
2.8
|
|
Yonkers
|
20.3
|
26
|
5.7
|
In math, the percentage of students in grades 3-8 who scored at the proficient level increased slightly over last year in most of the Big 5 City School Districts. New York City’s proficiency increased by 1.2 percentage points; Buffalo increased by 1 percentage point; Rochester’s proficiency declined by 0.2 percentage points; Syracuse increased by 1 percentage point; and Yonkers increased by 0.6 percentage points.
|
% of Students Proficient in Math Across All Grades 3-8
|
|
2015
|
2016
|
Percentage Point Change
|
|
NYC
|
35.2
|
36.4
|
1.2
|
|
Buffalo
|
15.1
|
16.1
|
1
|
|
Rochester
|
7.4
|
7.2
|
-0.2
|
|
Syracuse
|
9.4
|
10.4
|
1
|
|
Yonkers
|
24
|
24.6
|
0.6
|
Black and Hispanic Students
In 2016, ELA proficiency across all grades for black and Hispanic students increased over last year, with increases seen both statewide and in New York City. Statewide, black students saw a 7.7-percentage-point increase in those achieving proficiency while Hispanic students experienced a 7.1-percentage-point increase. In both cases, the increases were greater than those seen by white students, who experienced a 5.6-percentage-point increase statewide. As a result, the achievement gap in ELA that separates the proficiency of black and Hispanic students from their white peers closed slightly statewide.
In New York City, black students scoring at the ELA proficiency level increased 7.6 percentage points; Hispanic students increased 7.4 percentage points; and white students increased 7.6 percentage points.
|
Statewide % of Students Proficient in Grades 3-8 ELA
|
|
2015
|
2016
|
Percentage Point Change
|
|
Asian/Pacific Islander ELA
|
52.5
|
59
|
6.5
|
|
Black ELA
|
18.5
|
26.2
|
7.7
|
|
Hispanic ELA
|
19.7
|
26.8
|
7.1
|
|
American Indian/ Alaska Native ELA
|
23.8
|
29.9
|
6.1
|
|
White ELA
|
40.4
|
46
|
5.6
|
|
|
|
|
|
NYC % of Students Proficient in Grades 3-8 ELA
|
|
2015
|
2016
|
Percentage Point Change
|
|
NYC Asian/Pacific Islander ELA
|
52
|
58.8
|
6.8
|
|
NYC Black ELA
|
19
|
26.6
|
7.6
|
|
NYC Hispanic ELA
|
19.8
|
27.2
|
7.4
|
|
NYC American Indian/ Alaska Native ELA
|
28.7
|
34.9
|
6.2
|
|
NYC White ELA
|
51.3
|
58.9
|
7.6
|
Proficiency on the math exam statewide and in New York City also increased for black and Hispanic students in math this year, however, less than in ELA.
|
Statewide % of Students Proficient in Grades 3-8 Math
|
|
2015
|
2016
|
Percentage Point Change
|
|
Asian/Pacific Islander Math
|
66
|
66.5
|
0.5
|
|
Black Math
|
21.3
|
23
|
1.7
|
|
Hispanic Math
|
24.5
|
25.7
|
1.2
|
|
American Indian/ Alaska Native Math
|
30.7
|
29.5
|
-1.2
|
|
White Math
|
49.7
|
50
|
0.3
|
|
|
|
|
|
NYC % of Students Proficient in Grades 3-8 Math
|
|
2015
|
2016
|
Percentage Point Change
|
|
NYC Asian/Pacific Islander Math
|
66.8
|
67.2
|
0.4
|
|
NYC Black Math
|
19.1
|
20
|
0.9
|
|
NYC Hispanic Math
|
23.7
|
24.3
|
0.6
|
|
NYC American Indian/ Alaska Native Math
|
34.3
|
32.2
|
-2.1
|
|
NYC White Math
|
56.7
|
57.8
|
1.1
|
English Language Learners
Statewide in ELA, proficiency increased for both “Ever ELLs” (students who received ELL services prior to but not during the 2015-16 school year) and “Never ELLs” (students who never received ELL services). Ever ELL students performing at the proficiency level increased by 9 percentage points this year while Ever ELLs outperformed all grade 3-8 test takers combined, statewide.
In math, Ever ELL students scoring at the proficiency level increased by three percentage points while Never ELL students experienced 1.0-percentage-point increase in proficiency.
|
% of Students Proficient in Grades 3-8
|
|
2015
|
2016
|
Percentage Point Change
|
|
Current ELLs ELA
|
3.9
|
4
|
0.1
|
|
Ever ELLs ELA
|
30.5
|
39.7
|
9.2
|
|
Never ELLs ELA
|
33.9
|
40.8
|
6.9
|
|
|
|
|
|
Current ELLs Math
|
12.7
|
11.5
|
-1.2
|
|
Ever ELLs Math
|
40.6
|
43.6
|
3
|
|
Never ELLs Math
|
40.7
|
41.7
|
1.0
|
Students with Disabilities
Across the state, the percentage of students with disabilities who scored at the proficient level increased in both ELA and math. While a greater percentage of students with disabilities reached proficiency in 2016, their proficiency on the state assessments continues to be lower than the proficiency of general education students.
|
% of Students Proficient in Grades 3-8
|
|
2015
|
2016
|
Percentage Point Change
|
|
Student with Disabilities ELA
|
5.7
|
7.9
|
2.2
|
|
Student with Disabilities Math
|
10.6
|
10.9
|
0.3
|
Charter Schools
The percentage of charter school students who scored at the proficient level on the ELA exam across grades 3-8 increased this year, more so for students attending charter schools in New York City. Statewide, the proficiency of students in charter schools increased by 12.8 percentage points on the ELA exam while in New York City, proficiency increased by 13.7 percentage points.
In math, student proficiency increased less. Statewide, students in charter schools scoring at the proficient level increased by 3.9 percentage points on the math exam; in New York City, proficiency increased by 4.5 percentage points.
|
% of Students Proficient in Grades 3-8
|
|
2015
|
2016
|
Percentage Point Change
|
|
|
|
|
|
Charter Schools Combined Grades ELA
|
27.5
|
40.3
|
12.8
|
|
NYC Charter Combined Grades ELA
|
29.3
|
43
|
13.7
|
|
Charter Schools Combined Grades Math
|
41.5
|
45.4
|
3.9
|
|
NYC Charter Combined Grades Math
|
44.2
|
48.7
|
4.5
|
|
|
|
|
|
Early Grade ELA Improvement
Student proficiency on the ELA exam went up the most in grades 3 and 4 this year. Statewide, the percentage of third graders who scored at the proficient level increased by 10.9 percentage points over last year while fourth graders experienced an 8.1-percentage-point increase.
|
% of Students Proficient in ELA in Grades 3-8
|
|
2015
|
2016
|
Percentage Point Change
|
|
Statewide Combined Grade 3 ELA
|
31
|
41.9
|
10.9
|
|
Statewide Combined Grade 4 ELA
|
32.7
|
40.8
|
8.1
|
While one reason for the increases cannot be pinpointed, a variety of factors may have contributed. In response to feedback received from stakeholders across the state, the Department made a number of changes to the Grades 3-8 assessments this year including reducing the number of test questions on every assessment and allowing students who were working productively to complete their exams without time constraints. Further, teachers have had an additional year of experience with, and professional development in, the State’s higher learning standards. That added comfort and experience may have resulted in greater levels of student proficiency.
Not Tested Count and Test Refusal Count
Historically, SED only tracked the number of students not tested for an invalid, unknown reason. These students are categorized as “not tested” students. The not tested count includes students who were absent during the test administration period as well as students who refused the test. The count does not include students who were medically excused.
According to state data, approximately 78 percent of eligible students participated in the 2016 Grades 3-8 ELA and math tests, which is relatively flat compared to the previous year’s 80 percent. About 22 percent of eligible test takers did not participate in these tests and did not have a recognized, valid reason for not participating (not tested), again remaining relatively flat with 20 percent in 2015.
This year SED, in collaboration with the Regional Information Centers, improved its data collection methods and can now provide Test Refusal data. This year, the test refusal rate was approximately 21 percent, which is relatively flat with last year. A Test Refusal file by school district will be available online later today at: http://www.p12.nysed.gov/irs.
|
% of Students Statewide Not Tested & Test Refusal
|
|
2015 Not Tested
|
2016 Not Tested
|
2016 Test Refusal
|
|
20%
|
22%
|
21%
|
Department data shows about 50 percent of the test refusal students this year did not participate in 2015.
In addition, the 2016 test refusal students were much more likely to be from low-need or average-need districts; more likely to have scored at Level 1 and Level 2 in 2015 if they took the tests; less likely to be economically disadvantaged; less likely to be a student with a disability; and much less likely to be English Language Learners.
Like last year, this year’s proficiency rates represent the 900,000 students who actually took the test. There is no statewide measure of knowledge and skill for those students who refused the test.
School and District Results
A summary of the test results, as well as individual school and district results, will be available later today at: http://data.nysed.gov.
Video and Audio Available
Video and Audio of Commissioner Elia are available for download.
Audio: http://www.nysed.gov/common/nysed/files/2016-3-8-test-results-audio.mp3
Video: http://www.nysed.gov/video/2016-grades-3-8-ela-and-math-test-results
-30-