
Hits: 604
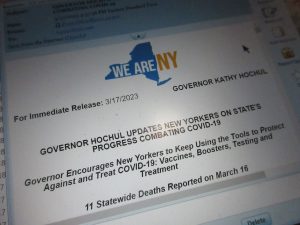
WPCNR QUARTERLY STATE OF LIFE SERIES # 1: STATE OF COVID. News & Comment by John F. Bailey. March 24, 2023:
The State of Covid will now be whatever our leaders say it is.
Because they who control the reports of covid spread or decline will now be only reporting results once a week on Fridays.
This is not a good development.
Those of you who make my weekly Covid Surveillance Reports developed from the daily trends of the communities in Westchester, Orange, Rockland, Dutchess, Ulster, Putnam and Sullivan Counties (the seven counties in the Mid-Hudson region) reported by the New York State Covid-19 Covid Tracker will not be worried any more or encouraged by lower numbers of new covid infections. You will understand whatever the state chooses to tell you.
Why? Any figures they will tell you will not reflect in real time the resurgence of the disease or the continued “diminution” of the disease. (What a lovely word! Diminution presents a very comforting feeling to the person who reads or hears it.
Once a week the authorities will analyze a week results, and who knows if they will level with us as to the real extend of the spread.
Why should they?
Because they have softened the real picture for a year and a half.
The state computerized data collection formats used the very questionable method of the Center for Disease breaking down the number of new cases reported per county by increments of 100,000 of population.
In order to know how many infections you have in a day, I the reporter, and you the person concerned about statistics must know the population of your county to know how many infections of covid are really happening a day.
Then multiply that out by week and 4 weeks of a month. The state could very easily report the infections by total population automatically without leaving us out here in queryland to do the math.
What this format has done is provide a false sense the disease is not as spreading a lot each day.
But unless you multiply it out according to 100,000 increments of population, the growth of cases is being reported with an error factor of as much as 50%.
Now the State as the Center for Disease Control announced a month previously, said Friday statistics are not going to be issued by the major stat providers. (I guess they are tired.)
This announcement by the state coincided with President Biden announcing the State of Emergency would end May 11.
Now Governor Hochul and the legislature currently controls covid policy and the right to announce a covid state of emergency again if needed.
To refresh your memory, the State Senators and Assemblypersons took this away from the Governor’s office during the sunset of the former governor (Andrew Cuomo). Now the senators and assemblypersons are now following suit.
The Governor’s updates on covid released to the press via email have basically stayed the same issuing new statistics based on the former day, sometimes on time and sometimes not — now are going to issue the stats for a week on new covid cases beginning this week. The day-by-day results will be on the New York State Covid Tracker dailyl
However the state is also looking at relaxing the amount of reporting hospitals have to provide on covid cases coming in, admissions.
It is unclear how detailed or curtailed the hospitalization figures will be. The statkeepers in the hospitals do not for the most part do hot treat patients.
I see no reason why that cannot still be reported the same way it is now. Hospitalizations broken down by daily covid cases compared to total hospitalization admissions.
My concern may be way off base, but the hospitalization stats you can get by hospital off the New York State Health Department Hospitalization site are hard to get a true picture because they are tough for the non-technical person to even access a hospital without knowing the hospital code. The hospitalization numbers are very difficult to access comparative information fast. (Perhaps that’s why few media report them in a comparative way that actually means something.)
Since the March 17 statistics came out, here is where Westchester County stands:
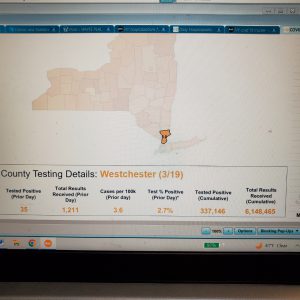
First the good news that the present daily statistics put out ended March 17
Westchester county had 35 positives if 1,211 tested 2.7%. The county over 7 days average 3.6 new cases a day per 100,000 population.
Westchester has completed a 13th week of decline in new covid cases with 175 cases compared to 254 last week. 989 for the 2 weeks and 3 days of March so far..
However, not so fast. At 3.6 new cases per 100,000 population a day over 7 days, you have to multiply that by 23.26 the number of 100,000 uncrements in Westchester population (1,040,000) to get the true daily figure.
The true daily number of cases for 1 day is 90 a day. Which is 634 for a week and over the month of March would give us 2,559 new cases in the month.
Perhaps this explains the high number of hospitalizations the 7 counties are experiencing the first three weeks of March
According to the report statistics on the hospitalizations graph for the Mid-Husdson Region of the 7 counties this is the hospitalizations were for the counties which have a total population of :

The population of the 7 counties in the Mid-Hudson Region is 2,326,000. That means there are 23.26 segments of 100,000 in the 7 county population. Multiply that daily figure of new covid patients hospitalized in 7 counties (55.56 per 100,000 people, you get 129 hospitalized patients with covid being hospitalized in 1 day March 16 in the 7 counties as of March 13.
Hospitalizations for 17 days in March for all 7 counties look like this:
MARCH COVID HOSPITALIZATIONS ICU INTUBATED COVID/DAY/100KPop DAY/WEEK/MONTH
17 117 11 5.56 129 /905 /3,621
16 129 10 5.56 129 /905/3,621
15 128 14 5.51 128 /897/3,588
14 129 13 5.56 129 /905/3,621
13 137 15 5.9 137 /960/3,842
10 136 12 5.86 136 /954/3,816
9 145 7 6.24 145 /1,015/4063
8 147 7 6.33 147/1,029/4,116
7 153 11 7 162/1,139/4,558
6 151 11 6.50 151/1,058/4,233
3 147 15 6.33 147/1029/4116
2 155 15 6.68 155/1,087/4,350
1 178 12 7.67 178/1,246/4,984
FEB 28 164 13 7.06 164/1,149/4,598
The above chart shows you what the probable hospitalizations will be across 7 Mid-Hudson Counties for the month of March– approximately 4,500 if the current average covid hospitalizations for covid continue
The hospitalizations for covid as you can see are going down from 164 as of February 28 to 129 last Friday..110but not by much. The average for the 7 counties for the 13 days is 144 for the 7 counties the new infections a day give you 1,015 infections a day, 4,000 cases in the month.
This covid is out there and we need to be aware.
How does this affect White Plains Hospital Center?
WHITE PLAINS HOSPITAL SITUATION
However, in White Plains alone, in the 30 days since February 15, White Plains Hospital Center has admitted 329 patients and 130 (40% of those admitted) were admitted for treatment of covid.
In the last week, White Plains has Hospital has seen some slowdown. Of 68 admissions, 42 were admitted for treatment of covid (62% of admissions) from March 8 to 15. March 1st through March 8, 42 persons of the 72 admitted (62%) were for treatment of covid.
Westchester County had 2,906 cases lab verified positive with covid in the month of February. But why all the hospitalizations across the 7 counties?
I worry there are just more covid positive persons out there who of antigen tested saw they were positive but have not gone to get lab verified becaus they need to work, need to take care of children and covid makes them sick and they eventually get so sick they have to have go to the hospital for treatment. This is just a hunch.
Significantly there is no data now telling the true nature of our covid situation.
If the state is thinking seriously about cutting data from the hospitals because they think it is no longer needed how with the State Senators and Assembly persons and county health officials decide if covid is under control or not.
We need more data not less.
If I was a health administrator I would demand, no, WANT to know:
- How long each covid infected person is now staying in the hospital.
- How many are reinfectees, so we can judge how many will come back. (They have to be coming back now)
- How many have long covid
- How much additional medications to they need.
- Do our hospitals have enough medication to take in these persons so sick they need to be admitted to the hospital at a 40% rate of admissions a day?
- We should stop worrrying bout keeping empty beds and worry about and find out aggressively what the disease is doing. Are we seeing new variants?
- The schools should be told to report new cases of covid, flu so we can see how the new laissez fair State Education Department you do not have to report cases of covid policy is working out. We do not know. Let me repeat that, we do not know.
- The disease roared back last July with 10,000 new cases in a month, and here after almost 7-1/2 months later we still seeing new cases over 7 counties at a 4,000 a month pace, what if this happens again, only on a larger scale, what will the leadership do?
- Vaccine boosters for the fall, will county residents have to pay for them? The public is not getting their full compliment of shots when they are free. It is not their fault. They have been told it’s O.K. with no reason except hopeful optimism. If covid throws a 6th wave at us by summer, somebody has to think about how they are going to get the unvaccinated and not completely vaccinated vaccinated.
- Restrictions have been completely relaxed. Leaders say we are getting back to a new normal. We’re told all about the wonderful things being done in Albany in the budget. Could do a little thinking about the covid situation please.
Thinking is something the leaders in Albany and Counties and cities and towns should do more of.