
Hits: 4129
LONG ISLAND SURGES FROM 500 CASES A DAY SUNDAY, MONDAY TUES LAST WEEK TO OVER 1,200 NEW POSTIVES A DAY AND NEW YORK CITY JUST SHY OF 3,000 A DAY FOR EACH DAY WEDNESDAY THURSDAY AND FRIDAY.
A SUSTAINABLE TREND OR LAST SURGE?
SCHOOL BREAK AFTERMATH INCREASES COVID CASES IN COUNTY PUBLIC SCHOOLS.
WPCNR COVID DAILY. From the New York State Covid Tracker. Observations & Analysis by John F. Bailey. May 1, 2022 UPDATED 10:32 P.M E.D.T.:
The Friday positive new covid persons number was the highest number recorded in the 4 weeks of April: 481, only April 21 even close (428). Prior to Friday, the last time Westchester had so many cases was on January 25, 13 weeks ago when 570 persons were found positive.
In the last two weeks of April, with Saturday results just in, we are seeing a pattern.
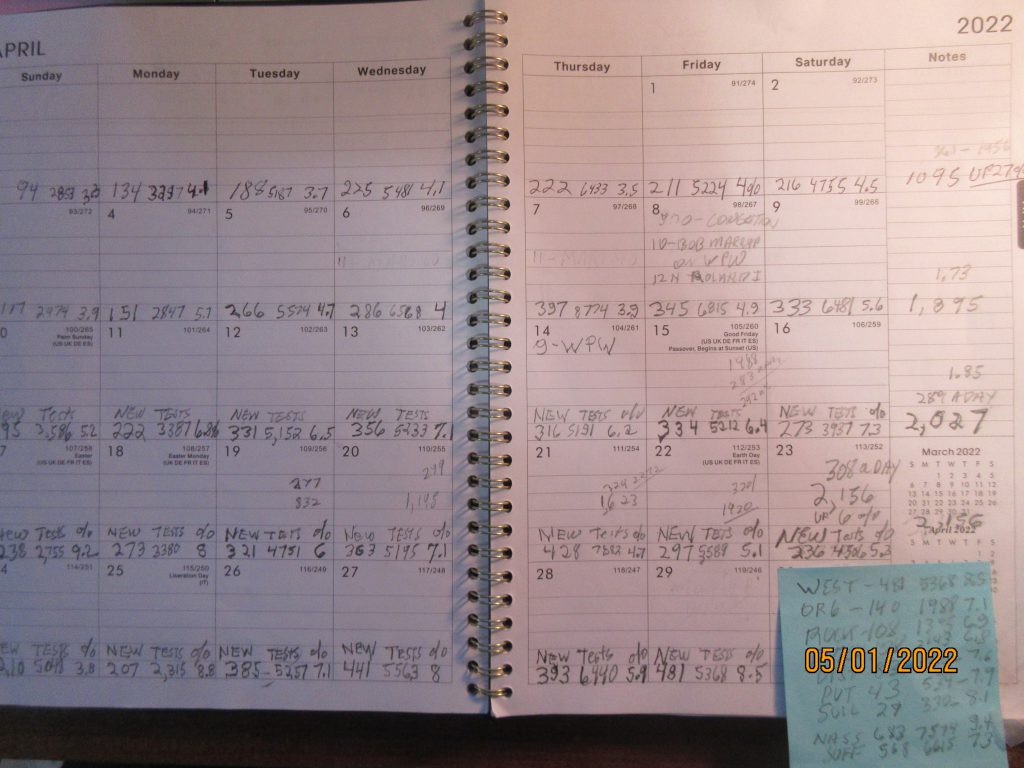
As the WPCNR Covid Logbook shows: testing quantities are down, yet infection rates are up especially in the Tuesday, Wednesday, Thursday Friday period. (People start going for tests when they get symptoms over weekends.)
Saturday results this evening reported 340 new positives among 4,760 testing Saturday bringing the April 24 to 30 week infections to 2,459 the highest total of the last 5 weeks.
Yet? And Yet?
We do not have demographics to determine what age groups are contracting the disease. Failure to break down the demographics prevents people from knowing who with shots or who without shots, or who do not have enough shots are getting infected and the seriousness of the disease when they get it.
In the six days of last week April 24 through 29, 29,991 tests were taken for covid and 2,117 tested positive, a 7% infection rate. If Westchester reports 200 positives on Saturday it will mark the 5th consecutive week of increased positives from the last week of March.
Three factors driving this may be the euphoria of relief from masking, socializing of persons of all ages and the feeling that covid is over. This a de’ja’ vu scenario of last spring when the NY legislature took away the former Governor’s emergency powers to make covid policy themselves and the oversight committee of both houses relaxed socializing, entertainment restaurant and venue rules.
By Mid-July after the July 4 weekend, cases started to rise resulting in increased cases in September and culminating in the largest wave of covid just 4 months ago in January when Thanksgiving and the holidays really spread the covid scourge–not so long ago. Remember?
The cases of covid hospitalizations are running 60 to 65% as of last week. How serious are those cases? Are they discharged, no ill aftereffects? Any ventilated? We need to know. Specifics, please? If the cases were light in the hospitalizing decision, how light were they?
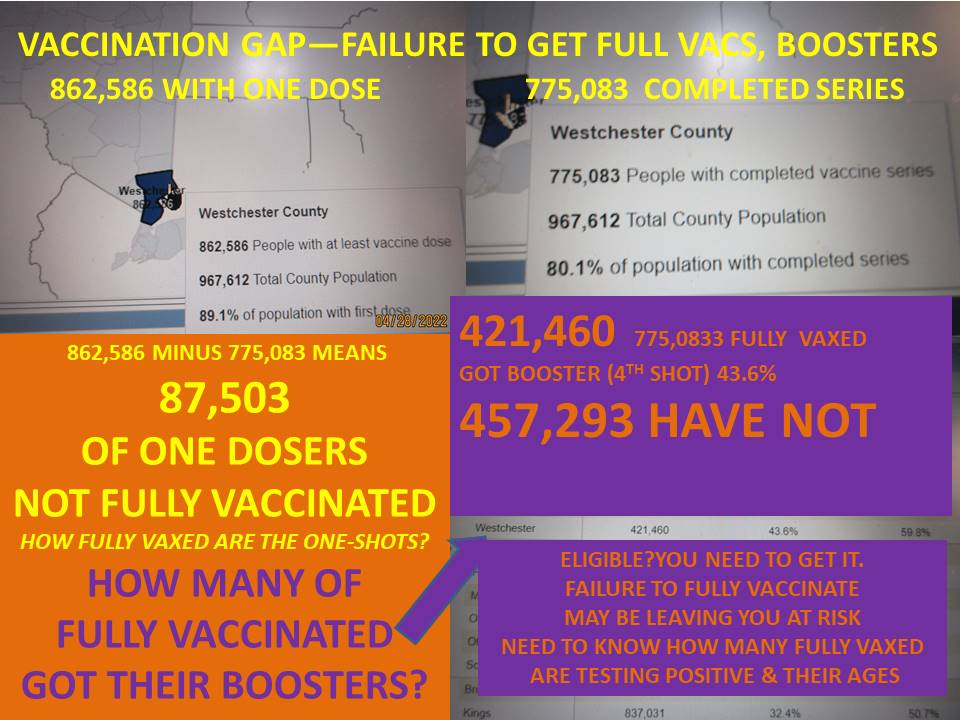
Are many who are infected of the new cases not fully vaccinated, (only have one shot, perhaps)? We do not have that break down of the vaccine status of persons who are not fully vaccinated . And there are a lot of them.
As a selling point on the vaccines we got a breakdown last summer from Governor Cuomo that 90% of new cases were of those who did not have the vaccine.
I did the math on the Westchester vaccinated universe in the chart below: There is a substantial gap of people who have one shot and how many are fully vaccinated. It would indicate to me and perhaps only me, that maybe, just maybe the undervaccinated are a portion of the new cases we are seeing. Maybe? Or maybe not? We need those numbers. And where is the contact tracing to bring shots to the people who still need them? You could make a public health ruling from Albany that everyone who needs a shot or not have a shot must get one. But Albany does not have the backbone to do that, I do not think.
However if infections keep going up each week you will see significantly more if you test more.
This could mean many people may be refusing to test themselves for fear of having to quarantine which they have to do if they test positive. This supposition is just that but, as I pointed out if you tested 12,000 persons in Westchester and 6000 of them tested at 6% positive as they did last Thursday, you would have 720 new positives in one day. Let’s call the non-tested universe out there the Phantom Positives. The statistics are remarkably exponentially reliable. They have proved that. You just have to see what the statistics are saying, if indeed we are not seeing what the infection rates on low quantities of tests are saying.
If you average 700 new positive covids a day, you would have 5,000 new infections a week. Those 5,000 spreading it even if only one person got it from them to 5,000 more, making 10,000 new infections in two weeks.
Is the 6-day infection rate of this last week which was an average of 7% positives a day a bell weather of a earlier beginning of a swelling of covid cases? I don’t know. If you want to make covid a regular part of life in Westchester, we have to find out more concrete information on how sick are the people getting “mild” infections and how sick are the persons who are being hospitalized and who they are. HIPPA privacy laws should not restrict the flow of information to make wise decisions not “hunch” decisions.
The infections town by town in Westchester are growing across the county. Here are the Westchester County worst infected regions as of Friday.
WESTCHESTER TOWNS AND CITIES MOST ACTIVE CASES/DAILY CASES PER DAY APRIL 29
1-YONKERS 647–56 DAILY CASES
2- NEW ROCHELLE 392–41 CASES DAILY (UP 171 IN 2 WEEKS)
3- WHIITE PLAINS 287, 32 CASES DAILY
4-GREENBURGH 273, 27 DAILY CASES
4-MOUNT VERNON 265, 22 DAILY CASES
5-YORKTOWN 243, 17 DAILY CASES
6-NORTH CASTLE, NEW CASTLE 233– 14 DAILY CASES
7-MAMARONECK TOWN, VILLAGE, LARCHMONT—202 — 19 DAILY CASES
8-MT. PLEASANT 174– 12 DAILY CASES
9-OSSINING TOWN & VILLAGE—164– 12 DAILY CASES
9-CORTLANDT—164—15 DAILY CASES
10- HARRISON, 153, 15 DAILY CASES
11- RYE CITY & RYE BROOK—147 CASES–14 DAILY CASES
12-TARRYTOWN & SLEEPY HOLLOW—143 19 DAILY CASES
13 BEDFORD—108- 12 DAILY CASES
14- SOMERS—102—15 DAILY CASES
This breakout above shows how the disease is infecting northern suburbs, the 3 largest cities at the top of the chart, but notably Port Chester and Peekskill do not make 100 cases.