
Hits: 519
WHITE PLAINS HOSPITAL COVID CASES RUN 42% OF ADMISSIONS 1ST 2 WEEKS OF FEB
WPCNR COVID SURVEILLANCE. From NYS Covid Tracker & NY Hospitalization Reports. Observation & Analysis by John F. Bailey.
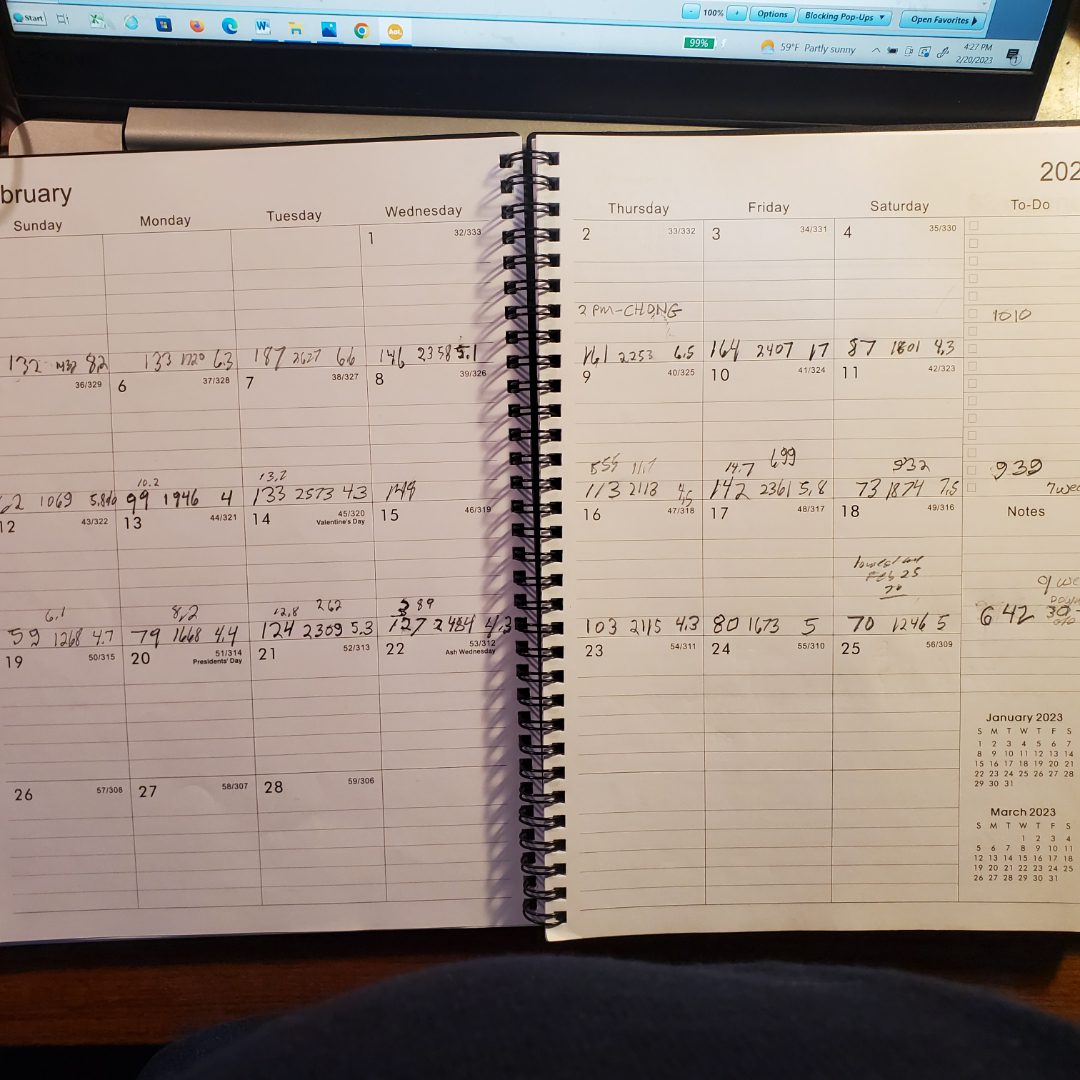
Westchester County recorded 642 cases of new persons testing positive for covid last week Sunday.
From February 12 through Saturday, February 18, it was the lowest number of cases in a week so far in the new year, the 9th straight week that cases have declined since the last week in December.
The county averaged 92 lab verified cases a day last week, slightly ahead of the average 7.2 daily cases a day per 100,000 population. Westchester population is 1,004,000 which works out to 10.04 100,000 segments. The daily average of 7.2 x 10.04 for Westchester indicates 72 daily infections a day , which works out to an average 2,020 case a month.
The 642 cases for the county last week shows that the county may be infecting at a pace slightly more than the 7.2 daily average indicates and could reach 2,400 cases in the month.
A concern locally is the number of new cases admitted to White Plains Hospital in the last two weeks has declined since February began but is still showing 40% of newly admitted patients are testing positive for covid according to New York Hospitalizations records through February 14.
The figures:
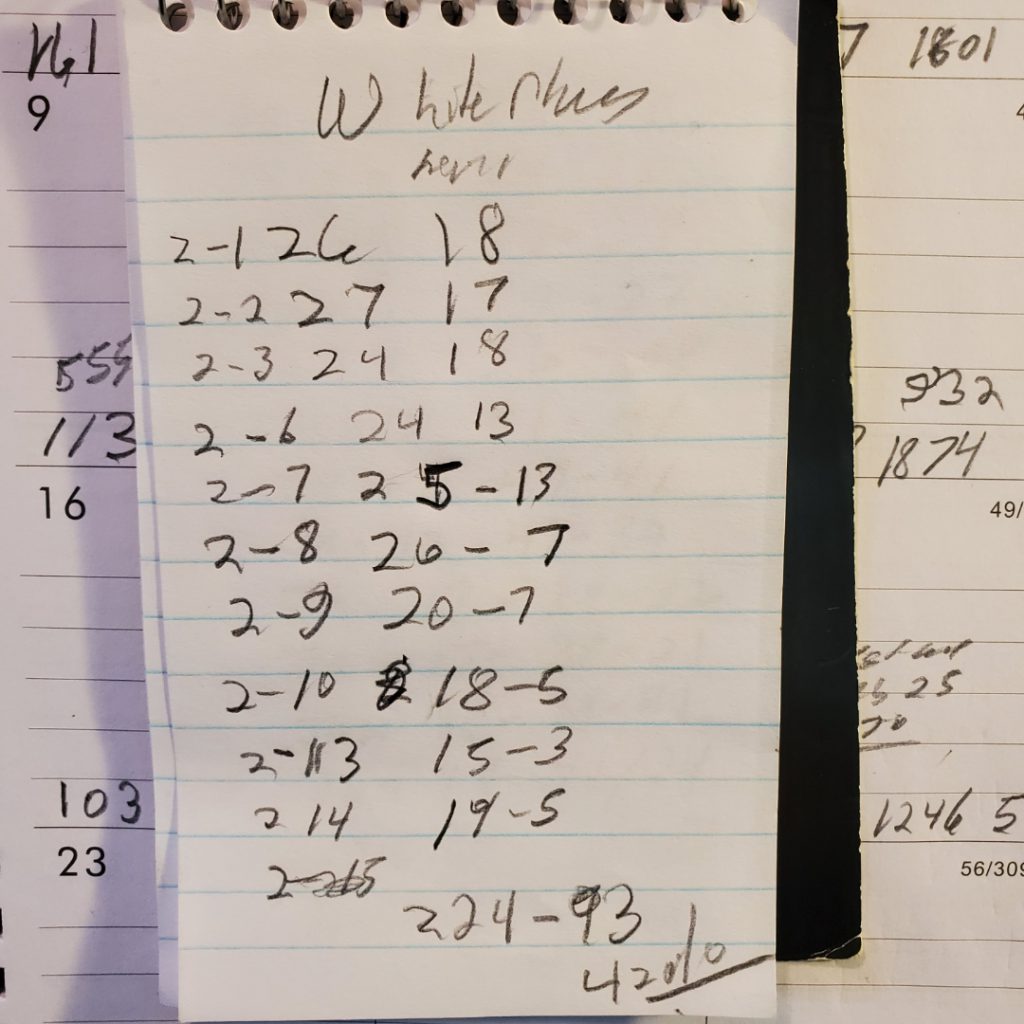
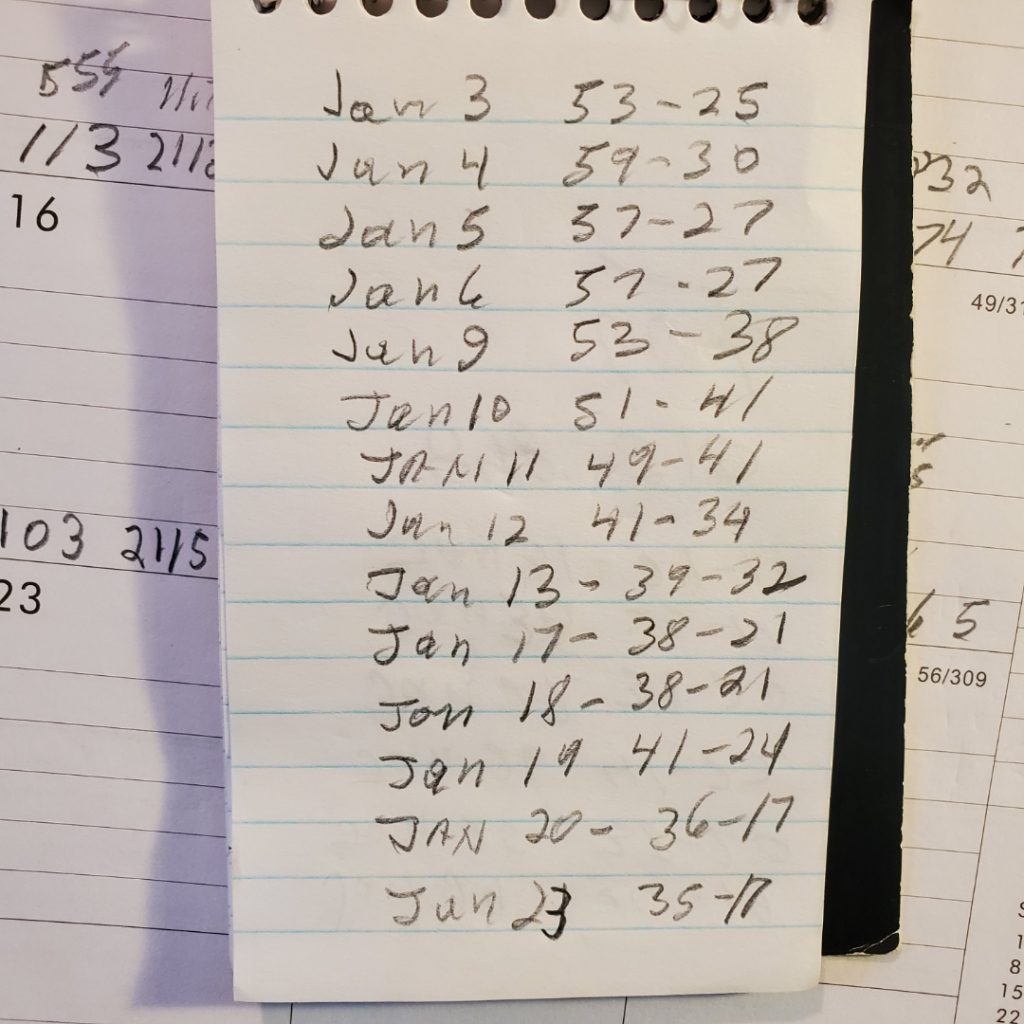
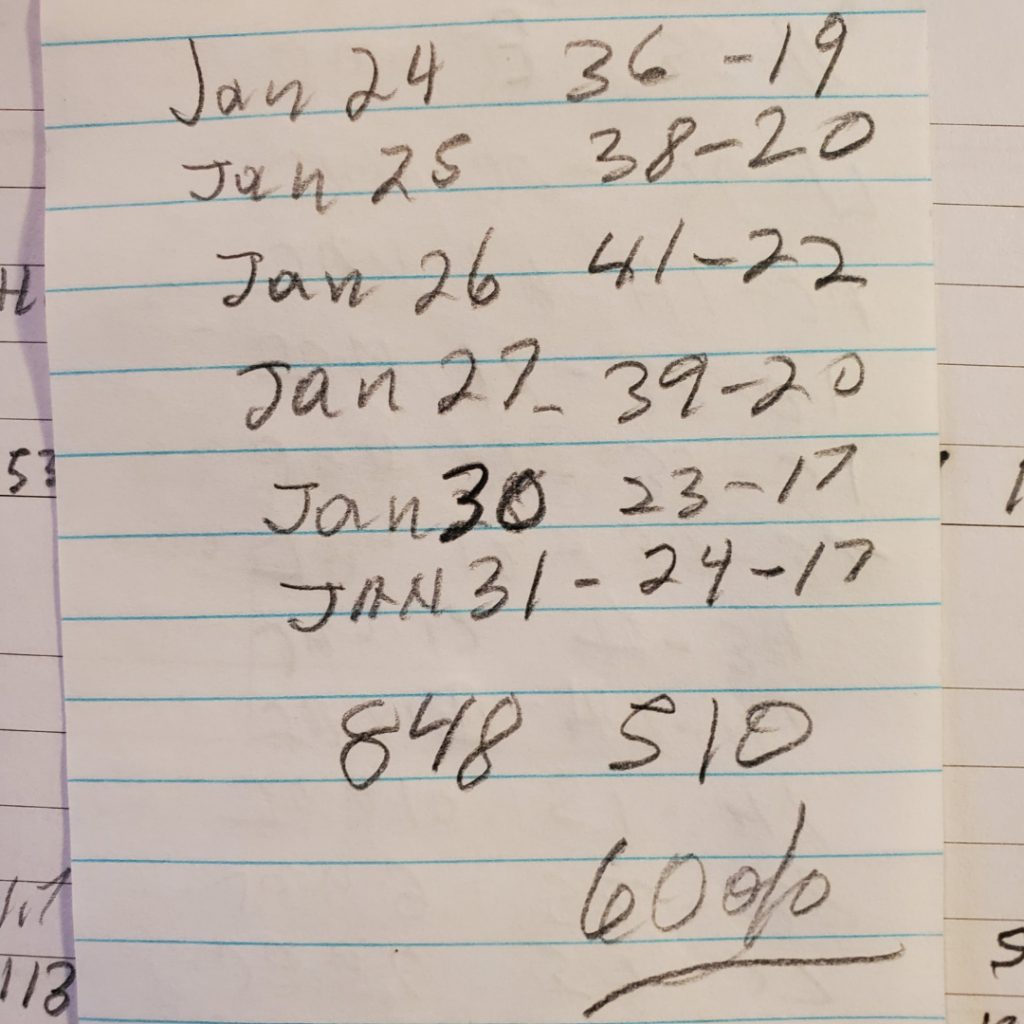
In January 2023 White Plains Hospital reported 840 Patients admitted and 510 were found treated for Covid 60% of admissions.
From February 1 to February 14, 224 admissions to White Plains Hospital reported 93 were positive for covid. The number admissions found to have covid after arrival had tested positive a percentage of 42%.
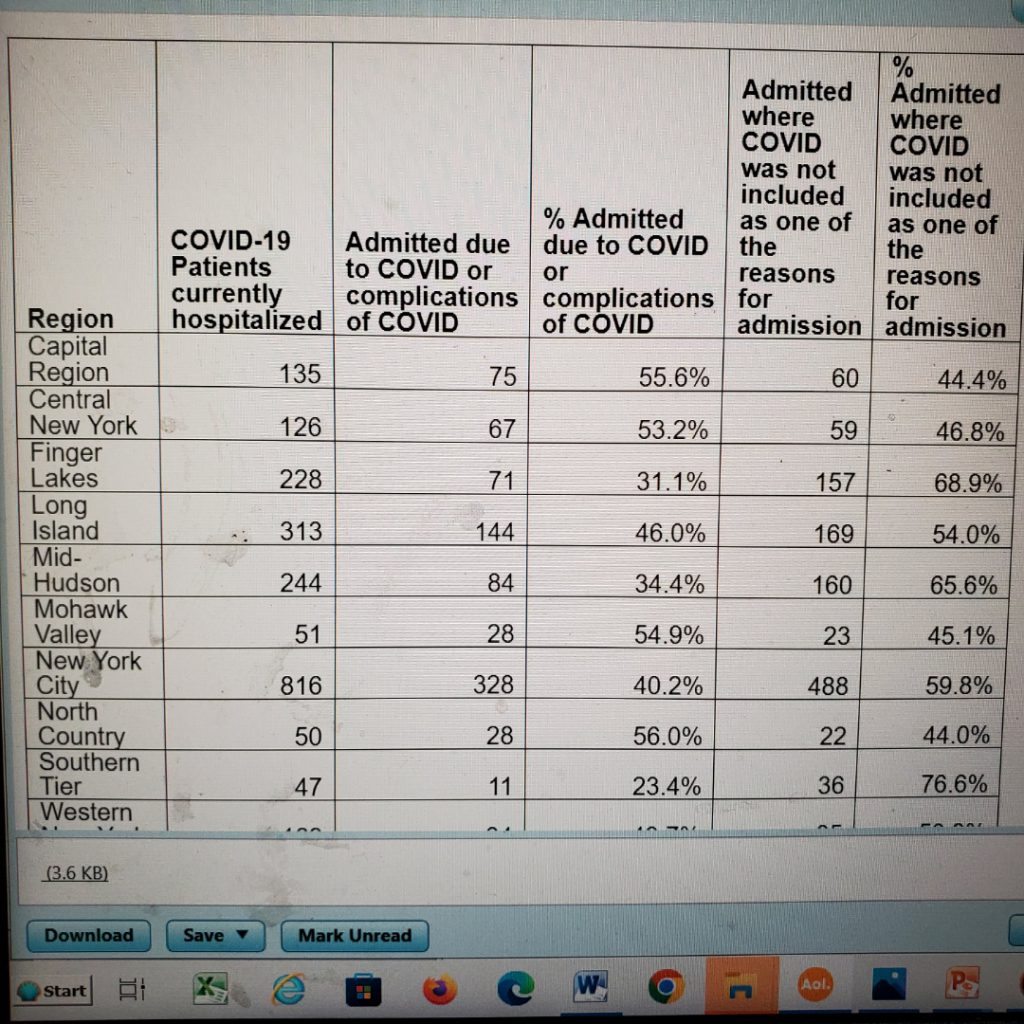
The Mid Hudson Region as of last Thursday, showed hospitalizations in the 7 counties in the region: Westchester, Rockland, Range Putnam, Dutchess Ulster and Sullivan Counties reported 244 persons admitted and 84 found to be positive with covid after admission a percentage of 34.4%.
On Long Island, Nassau and Suffolk Counties reported 313 admissions, 144 found to have covid or 46%
In the five boroughs of New York City, there were 816 admissions with 328 found after admission to have covid, 40.2%
An observation, if I may, if the numbers of positives indicated by the weekly daily rate is running ahead of the positive case reporting figures, confidence in how covid cases are appearing to decline with numbers publish, but by conservative presentation of daily numbers (broken down by 100,000 population segments, the numbers do not appear to give Mr. and Mrs. New York the true picture of the pace of disease slow decline, and are running behind actual positives in real time.
It is imperative the numbers be presented in crystal clear, comprehensive format to give the public the true picture of their risks of getting covid, which is a disease that lingers once you get it and comes back an back and back. You do not want to get it.
Here is how the week in covid looked ended February 18 region by region on hospitalizations for Covid
Here is how the Mid-Hudson Region did on covid infections : Saturday
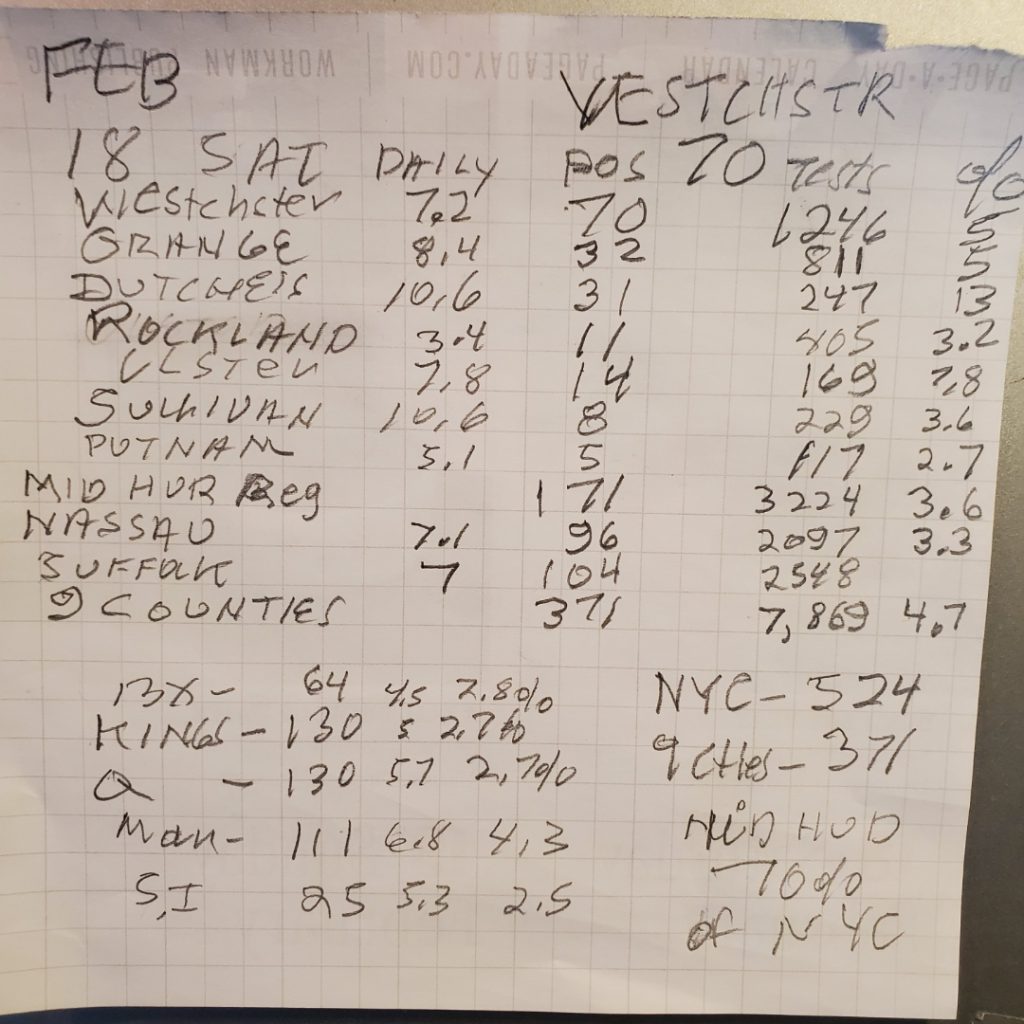
Some takeaway from this chart is the lowering infection rates on Long Island which has been notorious for new cases for the last three years. Infection rates in the Mid Hudson region are consistently above the 1:1 target (1 person infecting less than 1 other person Westchester infection percentage continues uncomfortably high at 5% of those tested, given that the Westchester testing activity is so low, 1,283 tests a day. If Westchester tested 5,000 a day, infections could be 250 a day (1,750 a week). (Since the county no stopped publishing its map of a county infections chart there is no way the public can see infections by town and city.)
The number are going up slightly on Tuesdays and and Thursdays but now significantly enough to decrease the weekly decline trend.
l