Hits: 539
WESTCHESTER 7 DAY SPREAD BY POPULATION: 391 – ON TRACK FOR CLOSE TO 3,000 INFECTIONS…
WPCNR COVID DAILY. From the New York State Covid Tracker. Observation & Analysis by John F. Bailey. June 2, 2022UPDATED 7:21 P.M. EDT:
The New York State Covid Tracker reported 349 Covid Positives in Westchester County yesterday without an explanation of any sort that the total of 349 was the cumulative positives for the last 4 days Saturday, the 28th, Sunday the 29th, Memorial Day the 30th and Tuesday, May 31st.
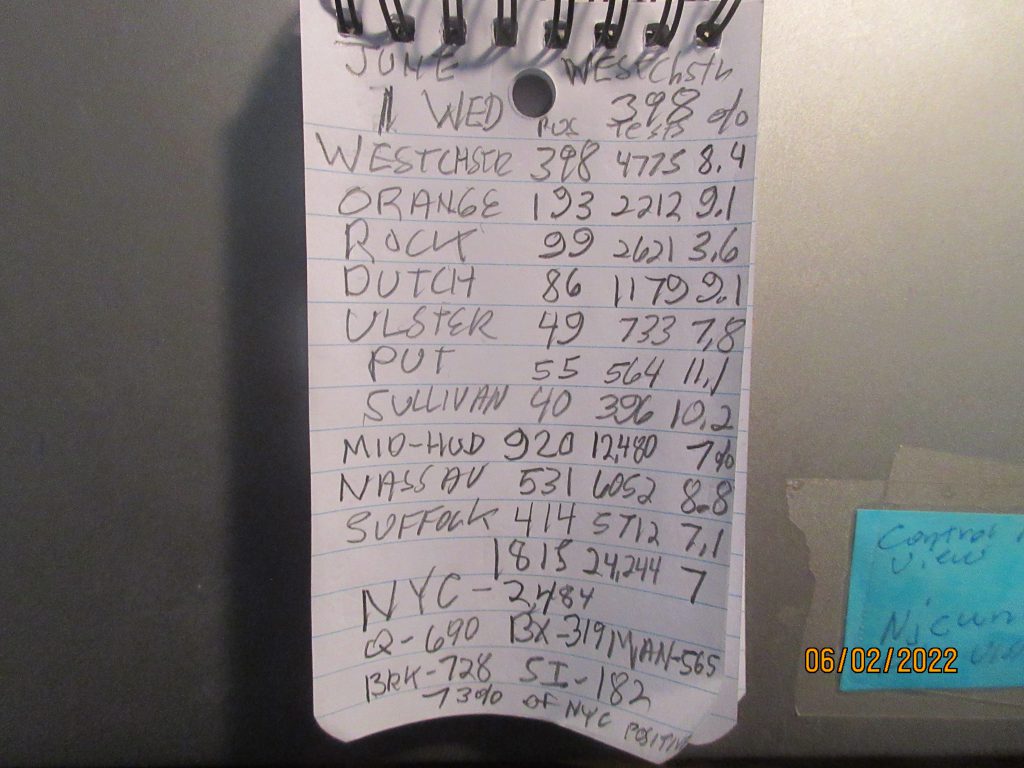
ON JUNE 1, the Covid Tracker reported late this afternoon, 398 testing positive Wednesday on 4,775 tested an 8.4% positve rate, bringing the county total since Sunday to 747, or 186 positives a day that would register 1,302 positive for the week if that pace continued. On Wednesday, the 9 counties surrounding Westchester reported 1,815 positive cases on June 1, yesterday, which is 73% of the 2,484 new positive cases New York City experienced Wednesday. IF the 398 level continues in that level of positives , the week total could reach 2,902 for the week by Saturday continuing the 3,000 a week pace for Westchester alone.
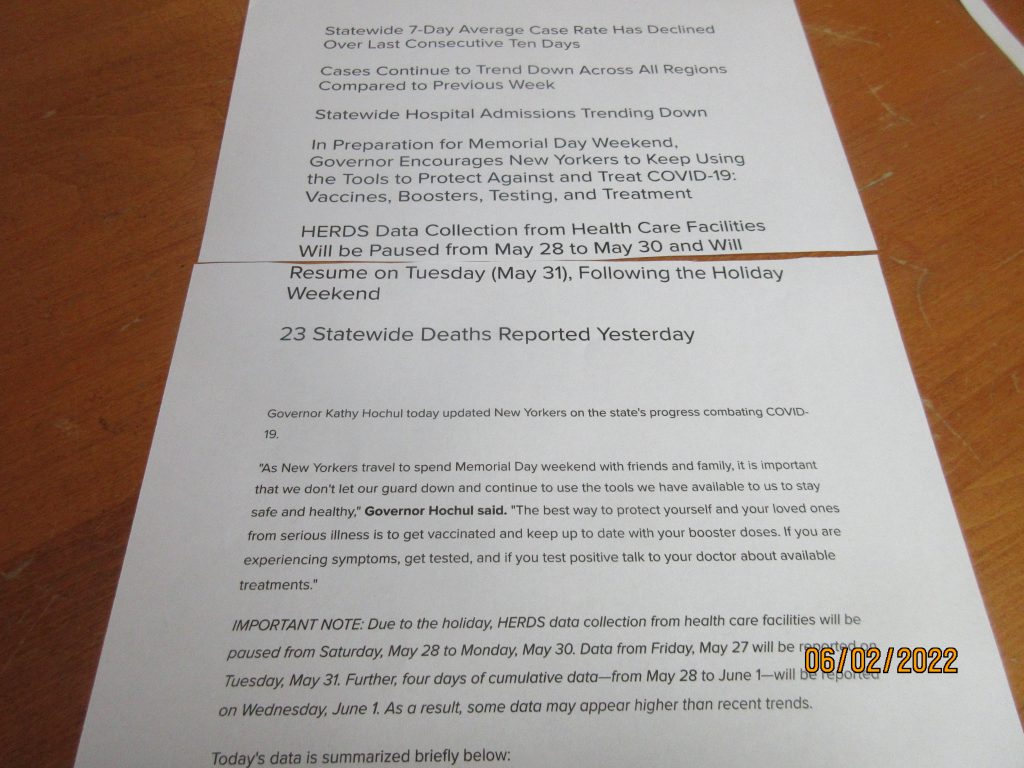
As WPCNR reported Monday, the state in a Governor Kathy Hochul covid update on May 17th said they would suspend reporting of test results over Memorial Weekend in this note pictured below:
WPCNR asked the Governor’s Press Office this morning if the Tuesday results were cumulative for all 4 days, since there was no special disclaimer on the standard state format explaining it was (or was not a 4 day total covering the 28th,29th,30th, 31st total positive tests for all the counties by county.
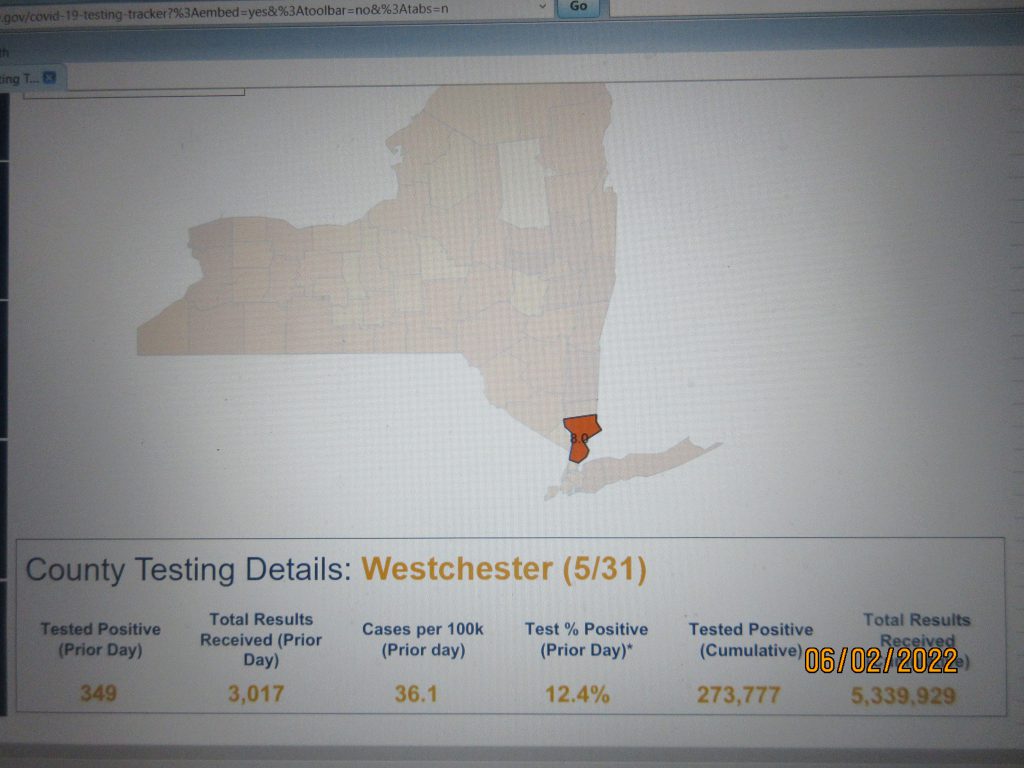
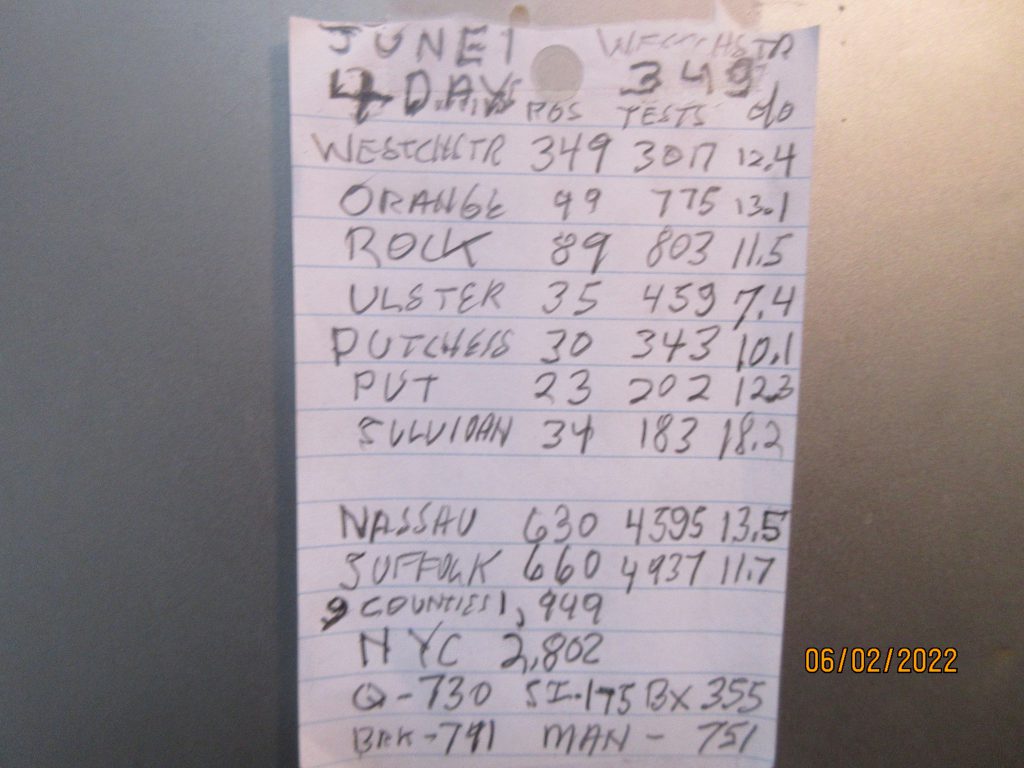
So, assuming as the state did exactly what they said they would do, the 349 new positives for Westchester are a total of the Saturday, Sunday Monday Tuesday positive results, which as the graphic from yesterday shows 349 positives for Westchester, let’s go to see what this appears to show:
The 349 new positive test results on 3,017 tests those last 4 days yield a 12.4% infection rate.
It is a little uneasy to realize that that infection rate the last 4 days is the highest infection rates since the week of January 9th to the 15th when we were testing 13,000 to 14,000 a day. On January 15 there were 17,534 tests with 2,171 infections (12.4%) This means that a lot more persons are spreading the disease right now than we know have it. WPCNR finds this a matter of concern.
A second way of measuring spread is the Positives per 100,000 metric that as WPCNR pointed out Monday gives a false impression of how good the counties across the state, including Westchester are doing. Last night, I broke out the state metric put out yesterday for the 9 counties surrounding New York City by total population.
Here is what I found:
MID-HUDSON AVG DAILY POS/100k 2020 POP. 7 DAY POSITIVES
WESTCHESTER 36 1,004,456 391
ORANGE 31 401,310 124
ROCKLAND 31 338,329 115
DUTCHESS 27 293,293 80
ULSTER 26 177,716 46
PUTNAM 32 97,668 32
SULLIVAN 37 78,624 29
7 COUNTIES 220 (31 avg) 2,391,396 817 (117 avg)
This means Westchester is averaging for last 7 days, 400 new positives weekly tops in the Mid-Hudson Region in spread, and each of the 7 counties including Westchester is averaging 117 new positives a week and 817 positives a week from all 7 counties combined.
It is easy to see why a positives per 100,000 calculation is more comforting for the Center for Disease Control to rely on. It has the effect of diminishing the scope of the spread across the nation and New York State over 7 days.
Down on Long Island, Nassau County and Suffolk showed these figures yesterday for previous 4 days.
AVG DAILY POS./100K 2020 POP 7 DAY POSITIVES WEEK
NASSAU 44.7 1,355,090 609
SUFFOLK 39.2 1,525,290 594
All 9 Counties combined for 2,020 new positives last week.
Take into account the figures for New York City on yesterday WPCNR COVIDSTOPPERS NOTEBOOK, and you can note that all 9 counties were counted for 1,949 new positives, compared to 2,802 for New York City.
The aberration caused by suspended counts the last 5 days has created perhaps too much of an impression that covid is over.
The numbers say otherwise.
Last week from May 15 to 21, Westchester had 3,510 infections, this week May 22 through 28, giving Saturday 87 new positives, the total for the week was 2,553 infections 27% less than last week.
We await tonight’s report.